
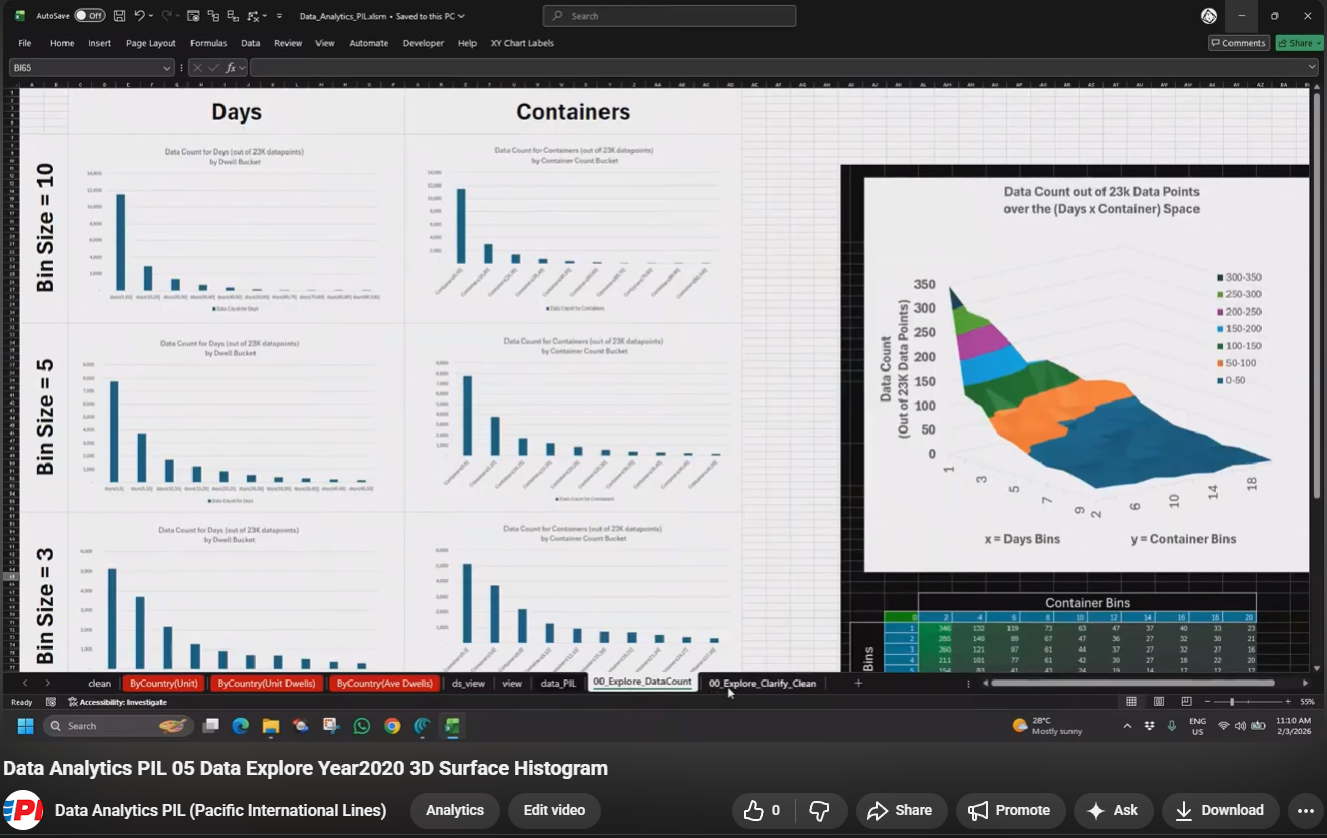
In this video, I summarize our exploration of the PIL dataset after the first four videos. We confirmed that all data points are from the year 2020 and checked the mapping of countries to continents for accuracy. I highlighted that China dominates the dataset in terms of the number of containers and units, with a mean of 79 containers and 5 days, indicating a skewed distribution. I also discussed the removal of outliers and demonstrated how to bin the data for better visualization. Please review the updated statistics and consider how we can further analyze this data moving forward.
00:00 Introduction to PIL Dataset
05:04 Descriptive Statistics
07:41 Outlier Removal
10:09 Binning Observations
13:33 Conclusion and Next Steps