Transport-Sea-Containers
Data Visualization
Dynamic Dashboard
Power BI
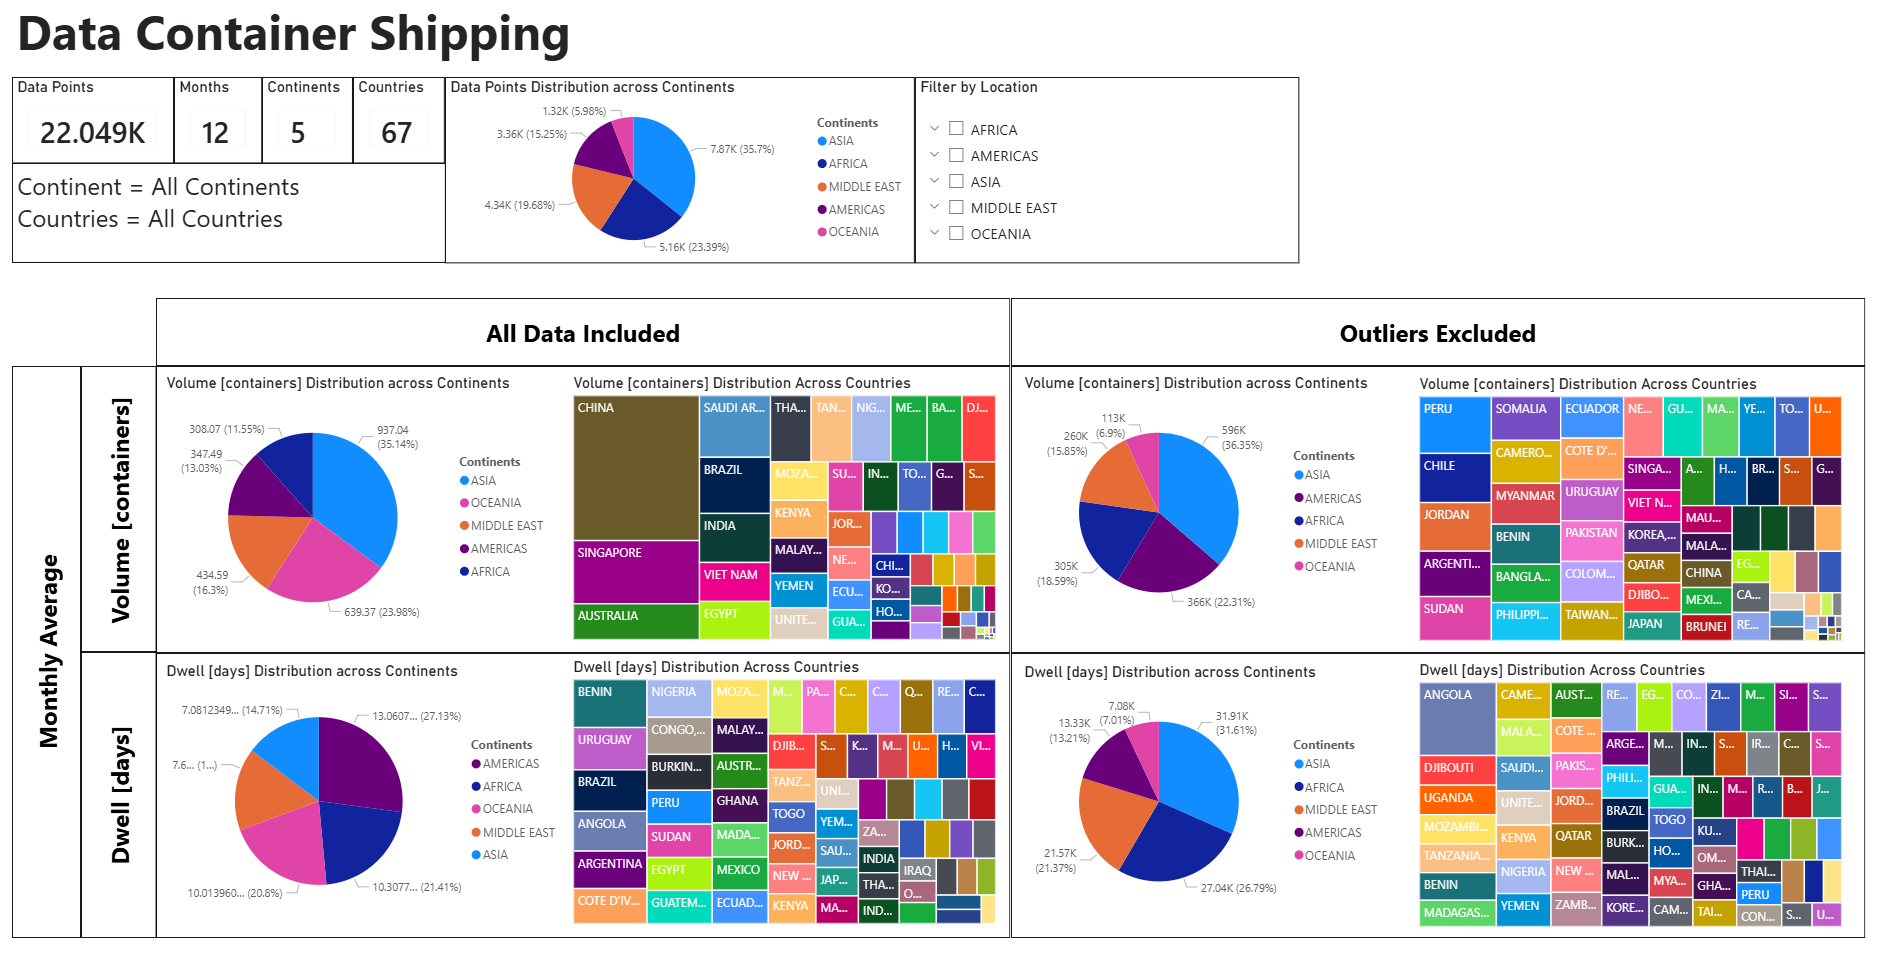
22,049 Data Points
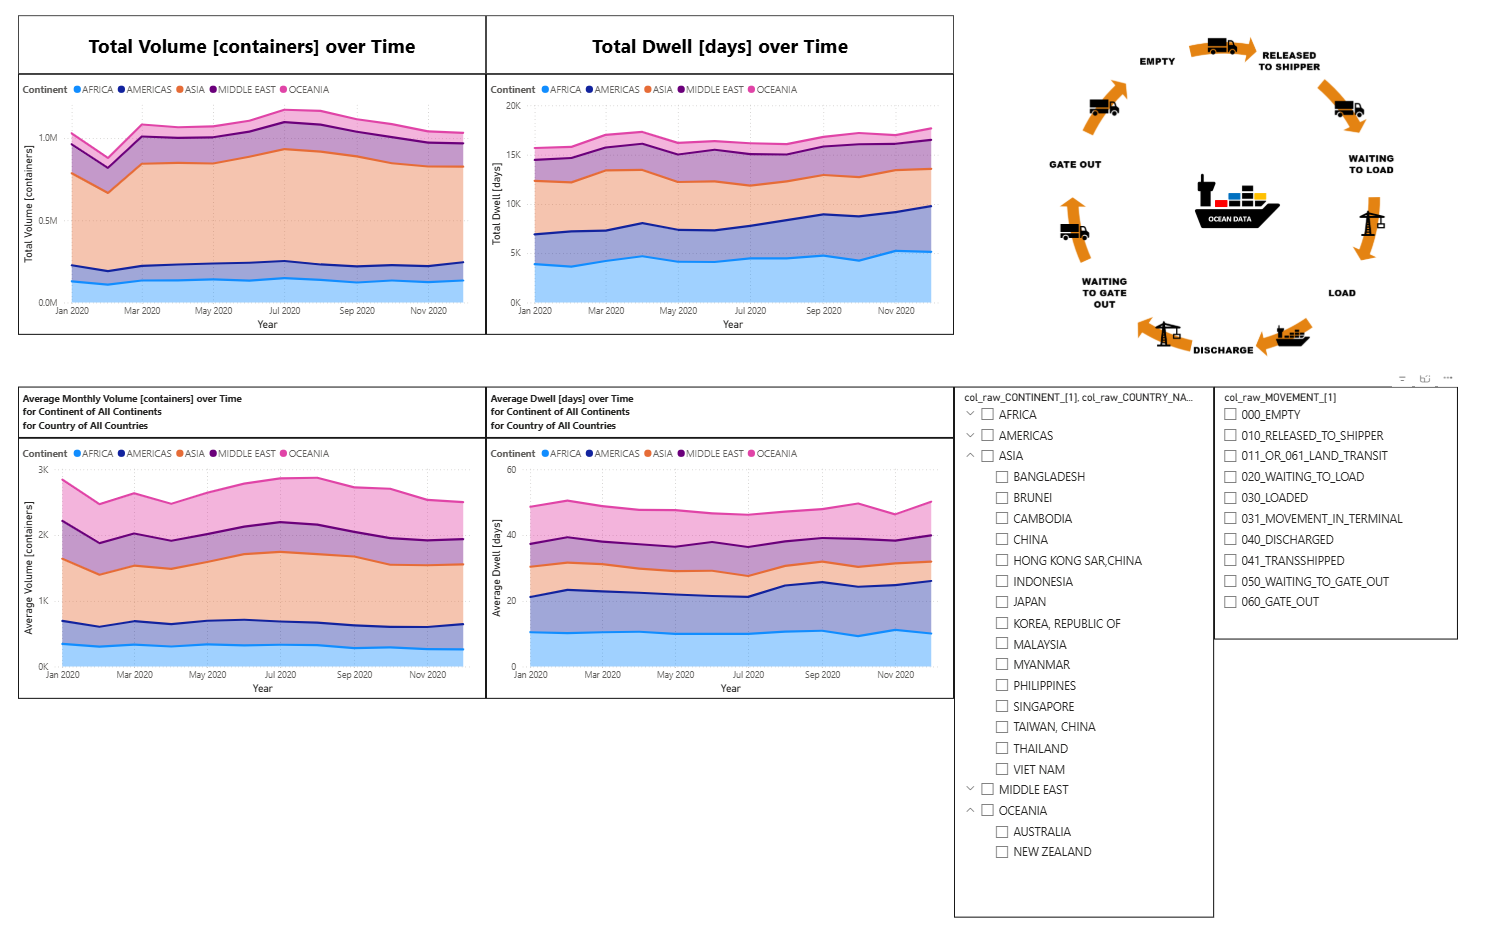
1 Year
12 Months
5 Continents
67 Countries
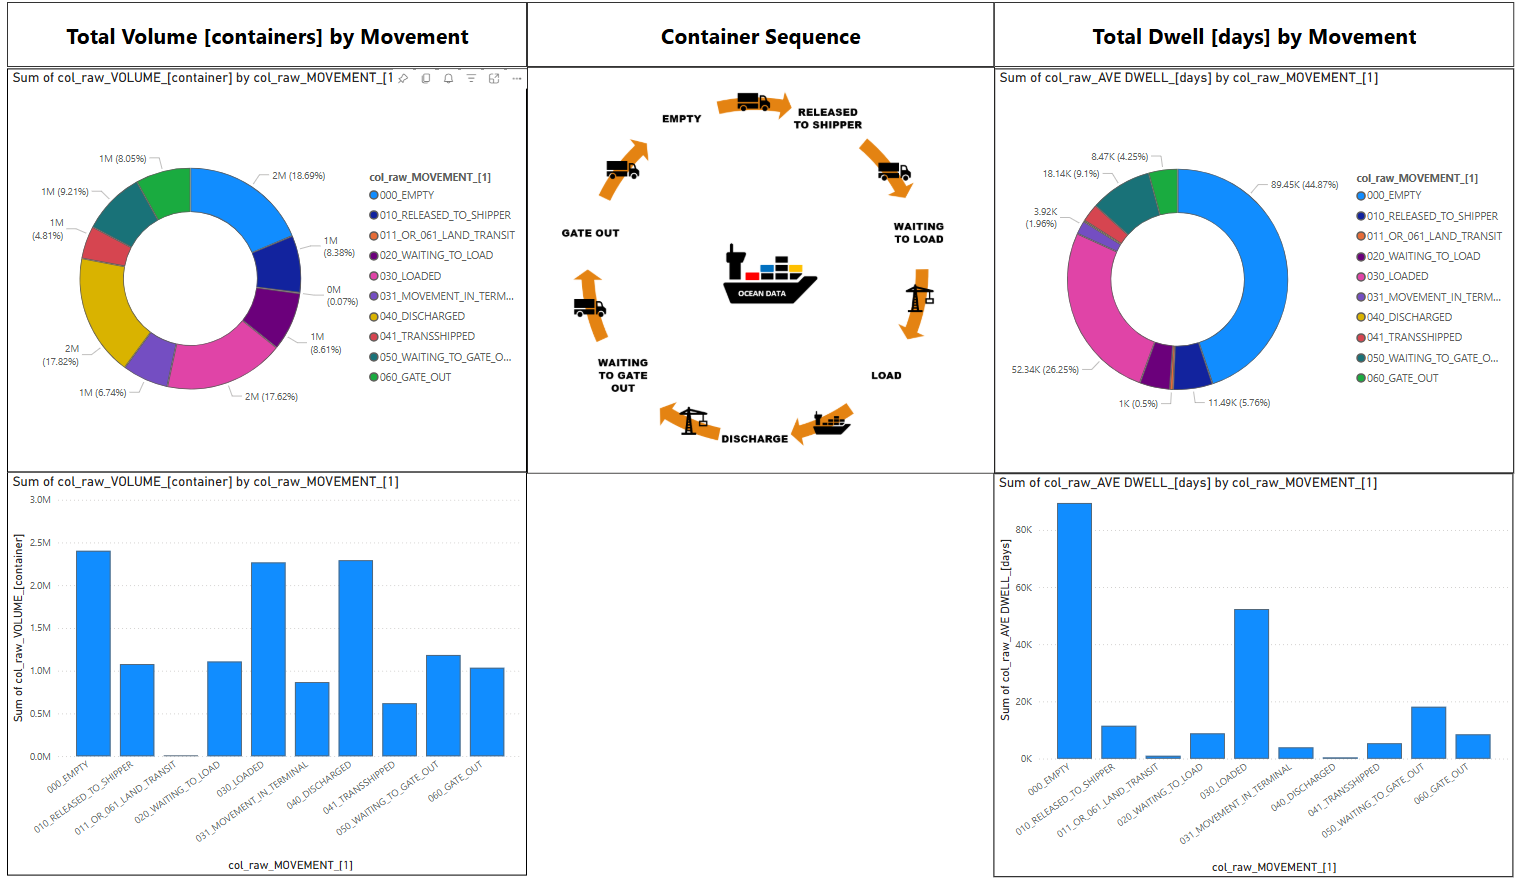
10 Movements
92 Movement Pairs
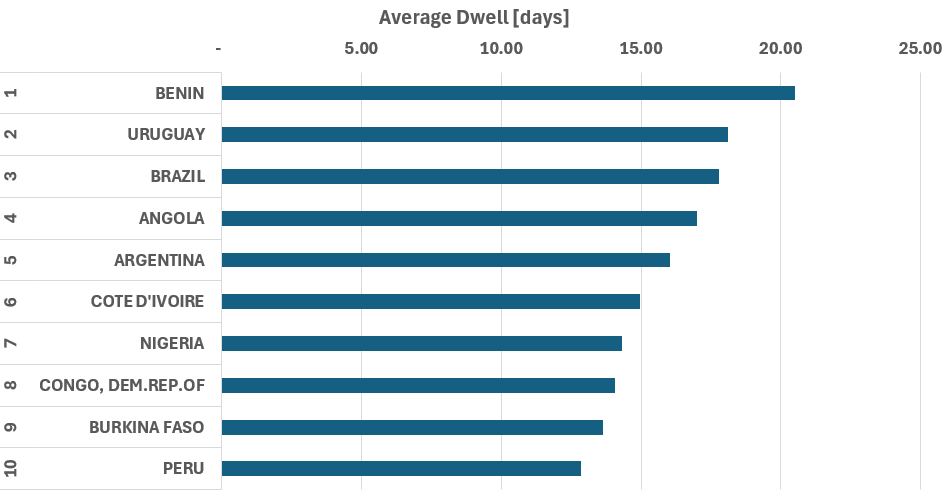
Dwell [days]
$$ \text{Dwell [days]} = \frac { \sum_{\text{records}} \left( \text{Volume [containers]} \cdot \text{Dwell [days]} \right) } { \sum_{\text{records}} \left( \text{Volume [containers]} \right) } $$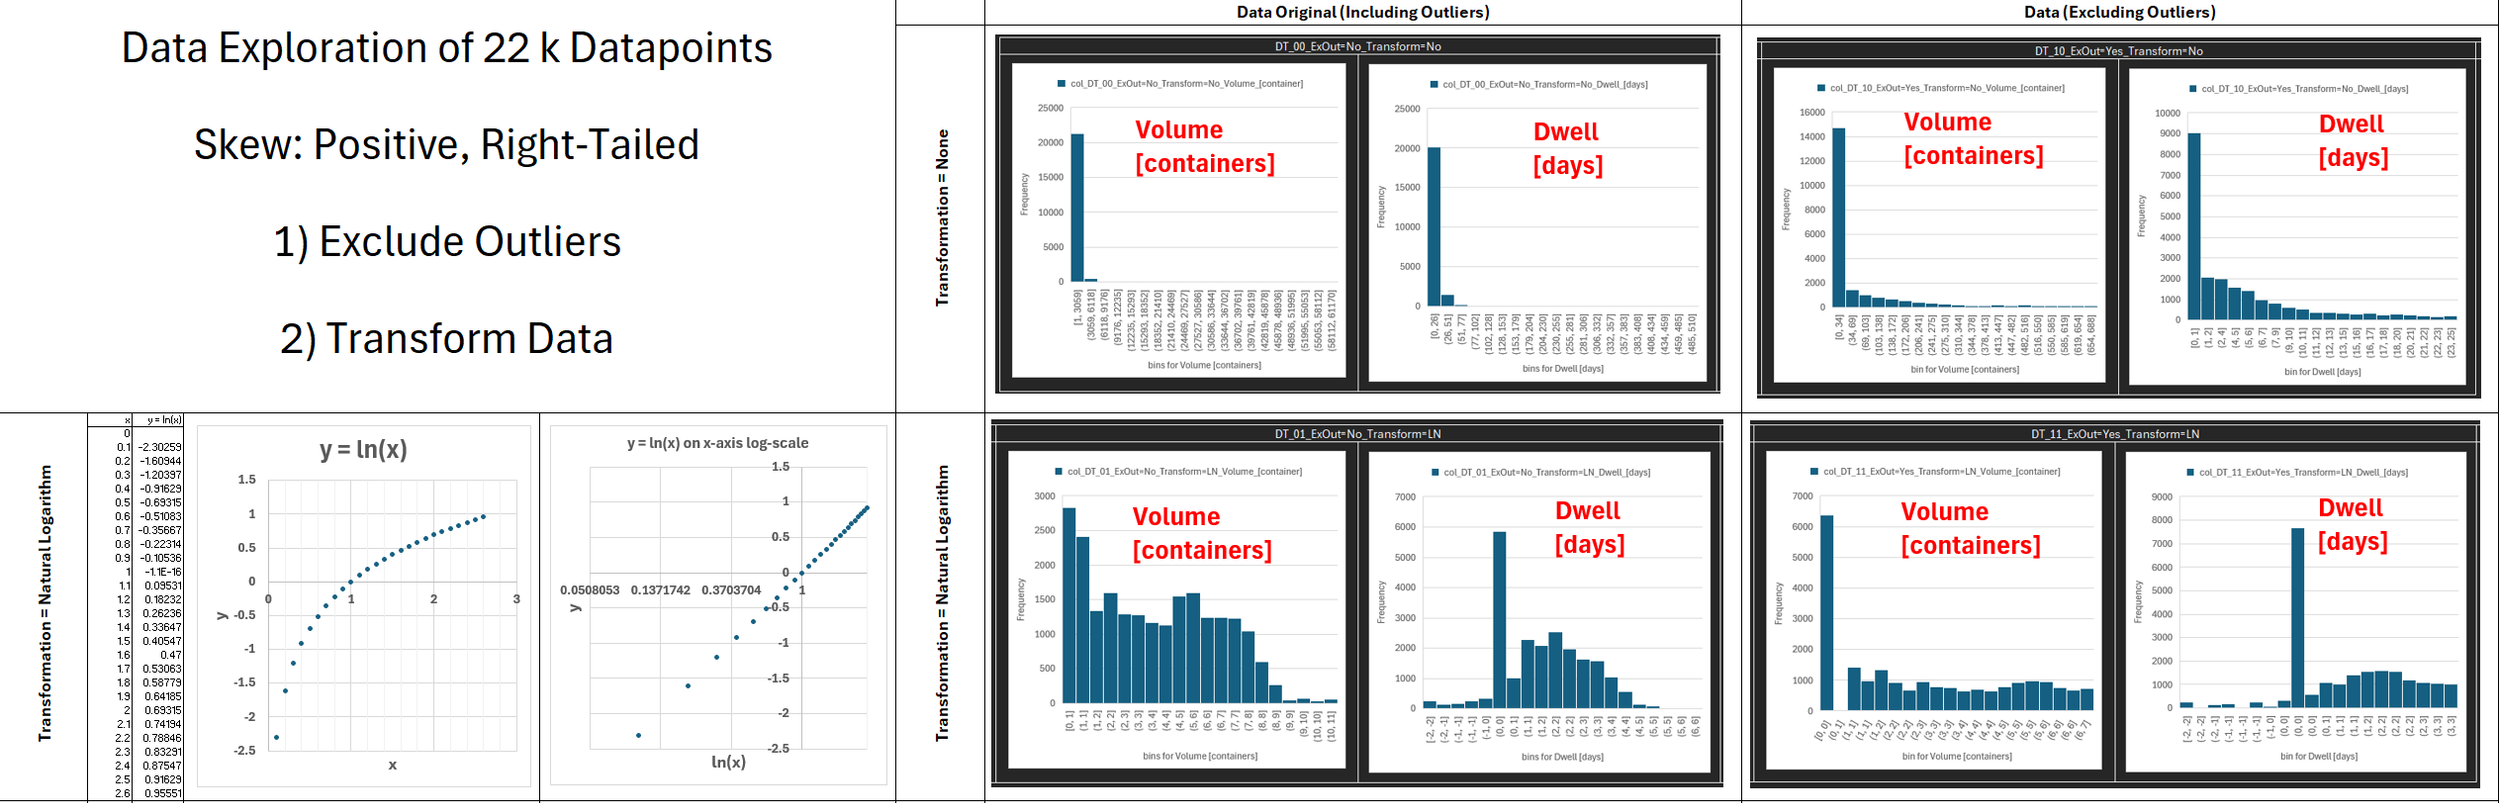
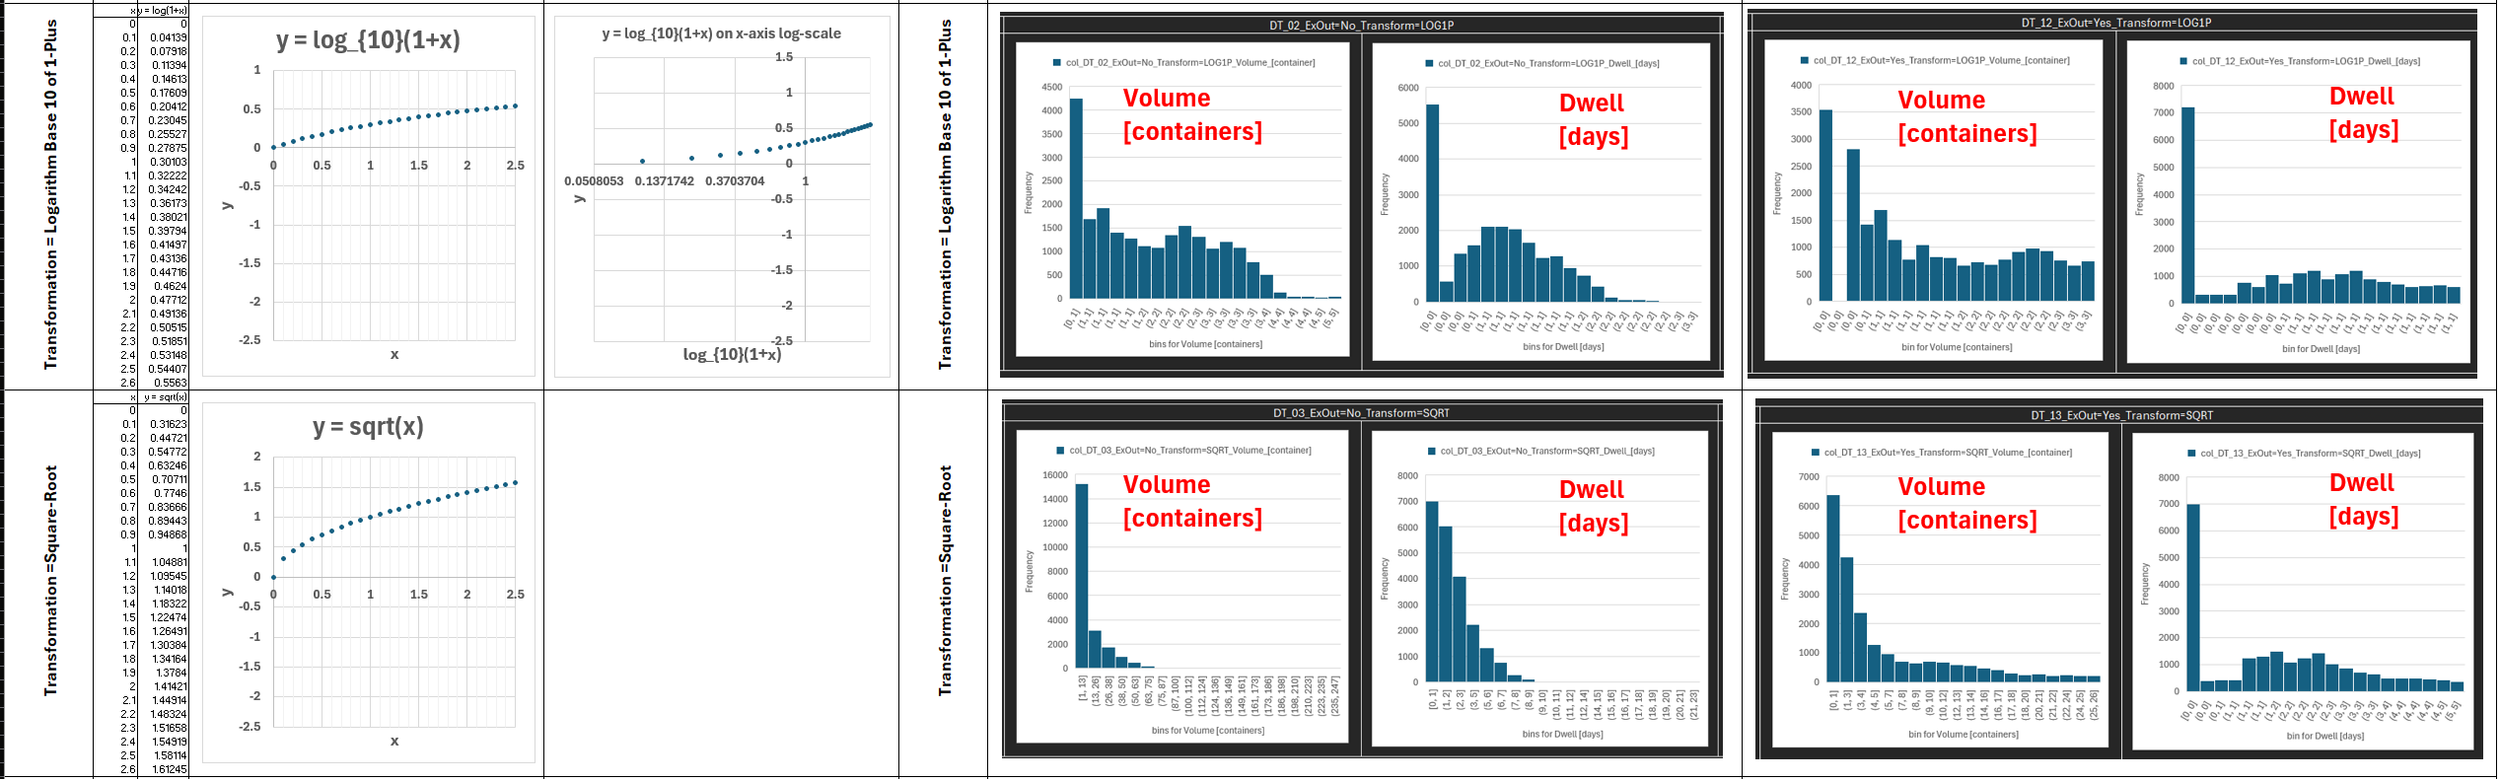
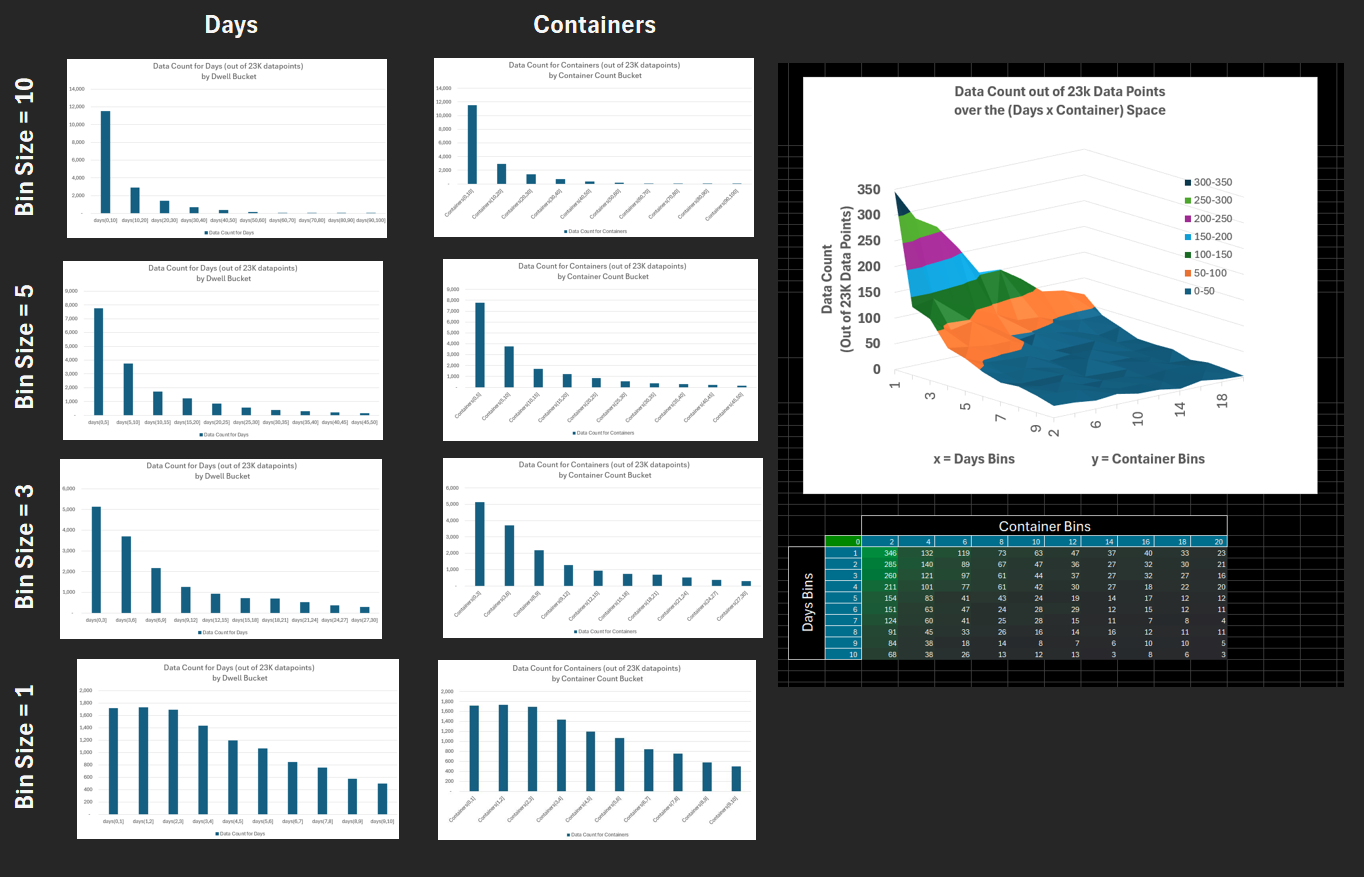
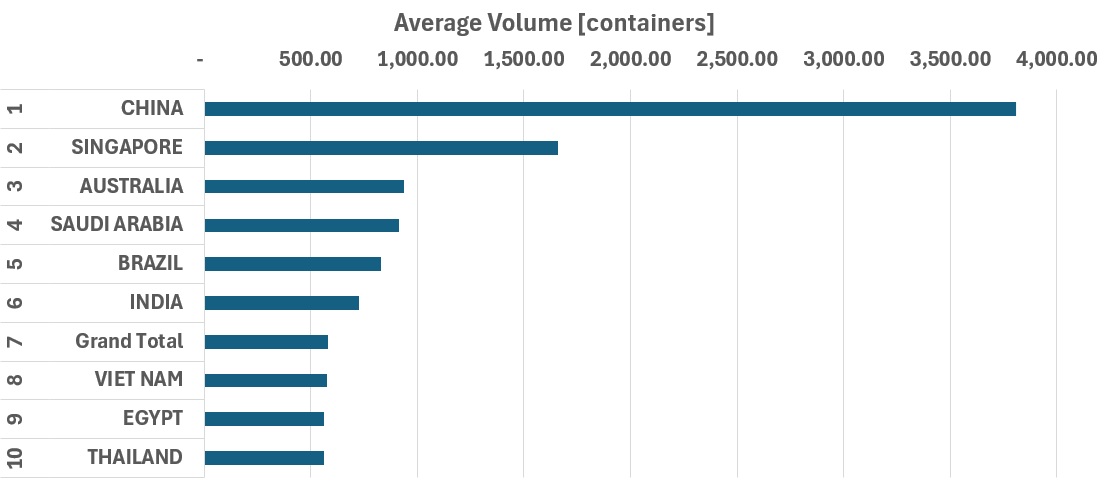
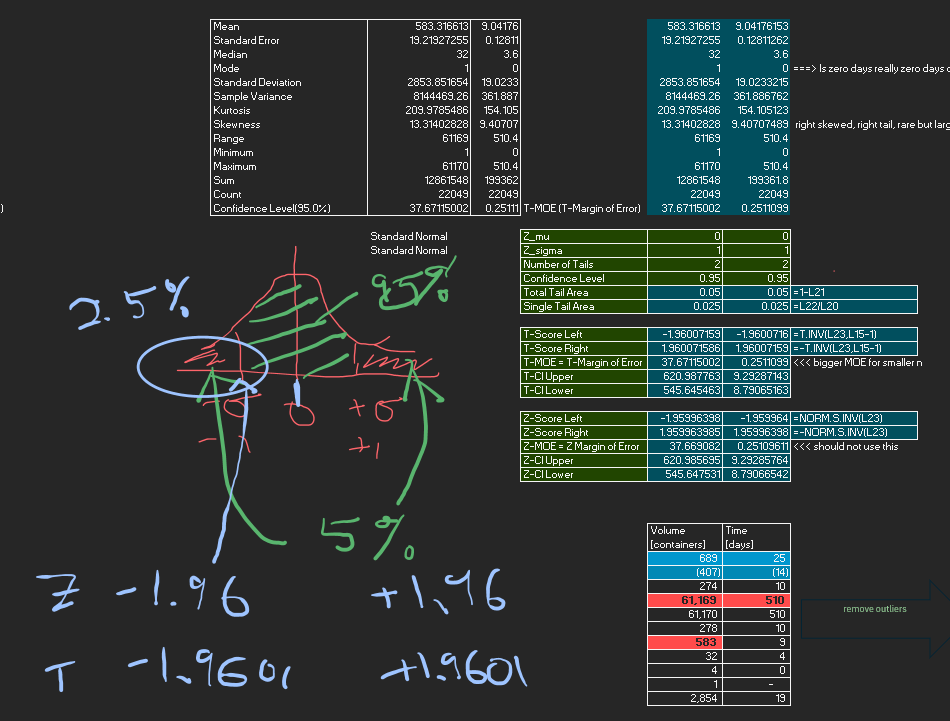
Global Container Volumes and Dwell Times in 2020

Data Period = 1 Year (2020)
Data Frequency = Monthly
by Continents
by Countries
by Movement Type
Volume [containers]
Dwell [days]

Here we explore the entire dataset for 2020
focusing on 2 numerical factors
1) Container Volumes measured in containers
2) Container Dwell times measure in days

Each datapoint is for a month, a location
So the 2 numerical factors can be expressed as:
1) Volume( t=month, loc=country )
2) Dwell( t=month, loc=country )

Both factors are clearly
- all non-negative
- positively skewed (long right-tail)

So we try two methods to transform the data
1) Exclude Outliers
2) Logarithmic Transformation (for non-negative values)
   2.1) y = ln( x )        : for data without zeros
   2.2) y = log( 1 + x)    : for data with    zeros
Data Original
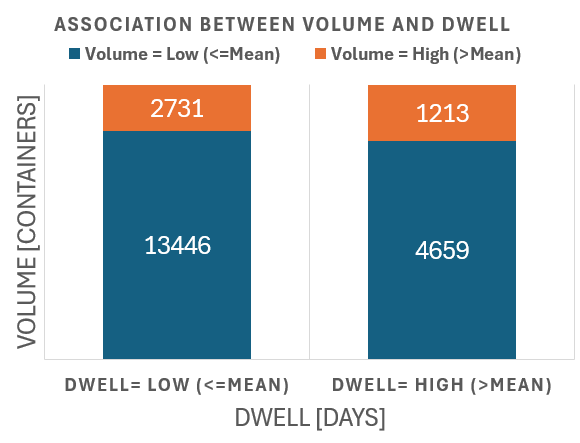
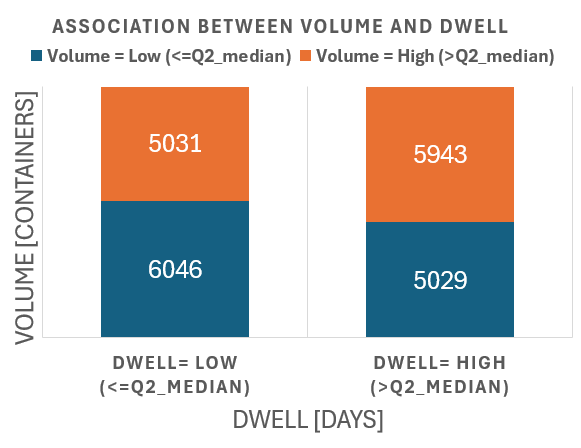
Top Row = Association Between
y = Volume [containers]
x = Dwell [days]
Top Left = Split High-Low by Mean
Top Right = Split High-Low by Median
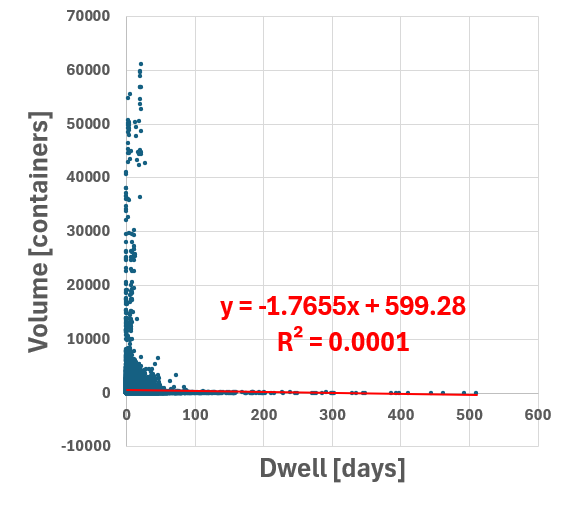
Bottom Left = Scatter Plot Betwwen
y = Volume [containers]
x = Dwell [days]
n = Sample Size
= 22049
r = rho_{s}
= Sample Correlation Coefficient
= CORREL( Volume, Dwell )
= -0.0118
Relationship between Volume and Dwell is
NOT LINEAR
Try Log-transformation
Data Transformed = ln( Data ) = Natural Logarithm of Data
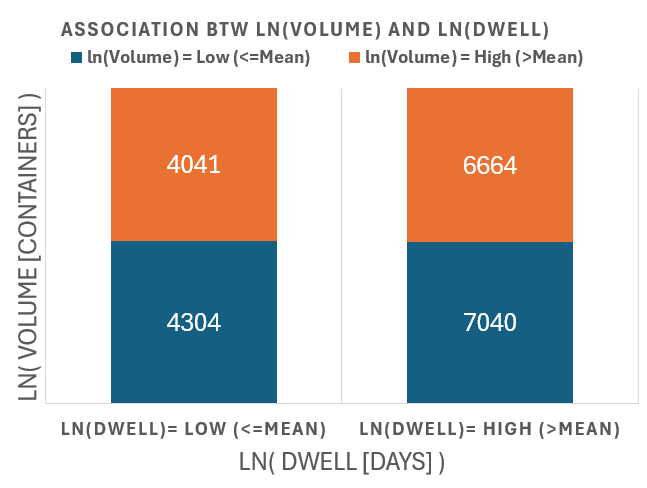
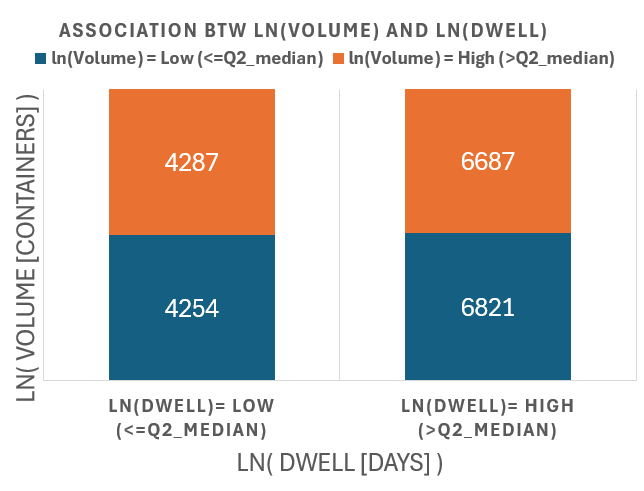
Top Row = Association Between
y = ln( Volume [containers] )
x = ln( Dwell [days] )
Top Left = Split High-Low by Mean
Top Right = Split High-Low by Median
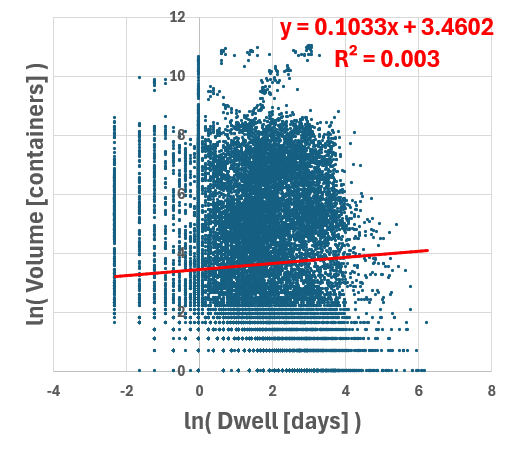
Bottom Left = Scatter Plot Betwwen
y = ln( Volume [containers] )
x = ln( Dwell [days] )
n = Sample Size
= 22049
r = rho_{s}
= Sample Correlation Coefficient
= CORREL( ln(Volume), ln(Dwell) )
= +0.0545
Relationship between Volume and Dwell is
STILL NOT LINEAR
Data Transformed = log_{10}( 1+Data ) = Logarithm Base-10 of 1-Plus-Data
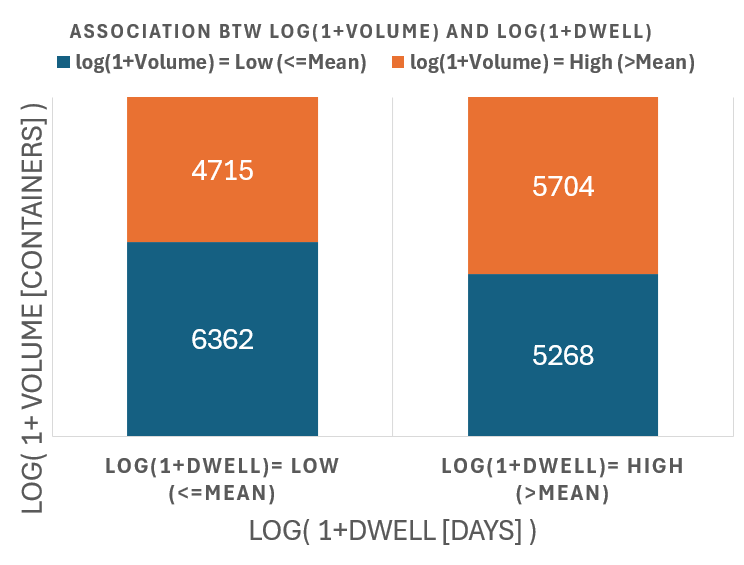
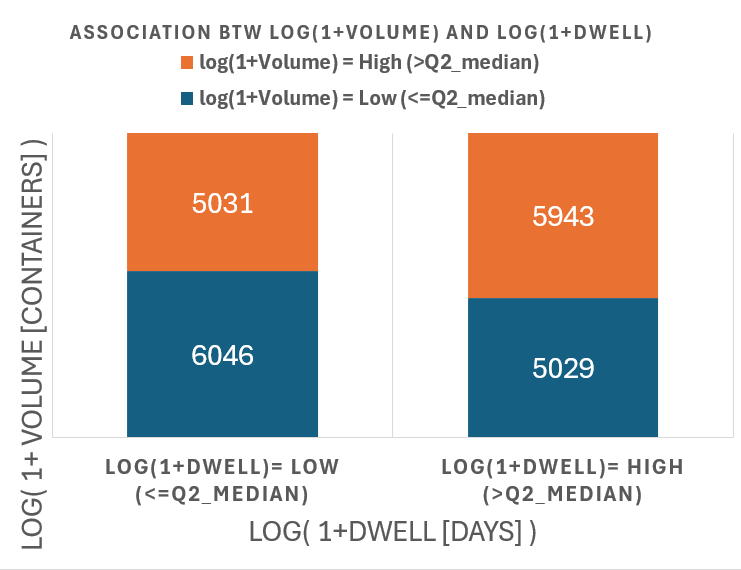
Top Row = Association Between
y = log( 1 + Volume [containers] )
x = log( 1 + Dwell [days] )
Top Left = Split High-Low by Mean
Top Right = Split High-Low by Median
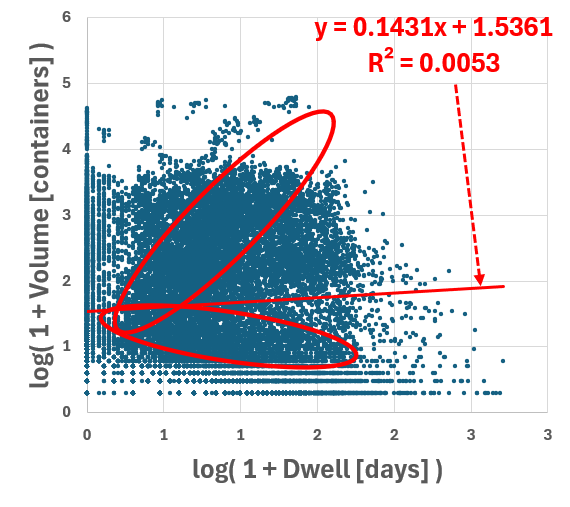
Bottom Left = Scatter Plot Betwwen
y = log( 1 + Volume [containers] )
x = log( 1 + Dwell [days] )
n = Sample Size
= 22049
r = rho_{s}
= Sample Correlation Coefficient
= CORREL( ln(Volume), ln(Dwell) )
= +0.0727
Relationship between Volume and Dwell is
STILL NOT LINEAR
but it looks like there is some form shaping up.
There looks like
a faint cluster with (+) correlation
a faint cluster with (-) correlation
Data Transformed = sqrt( Data ) = Square-Root of Data
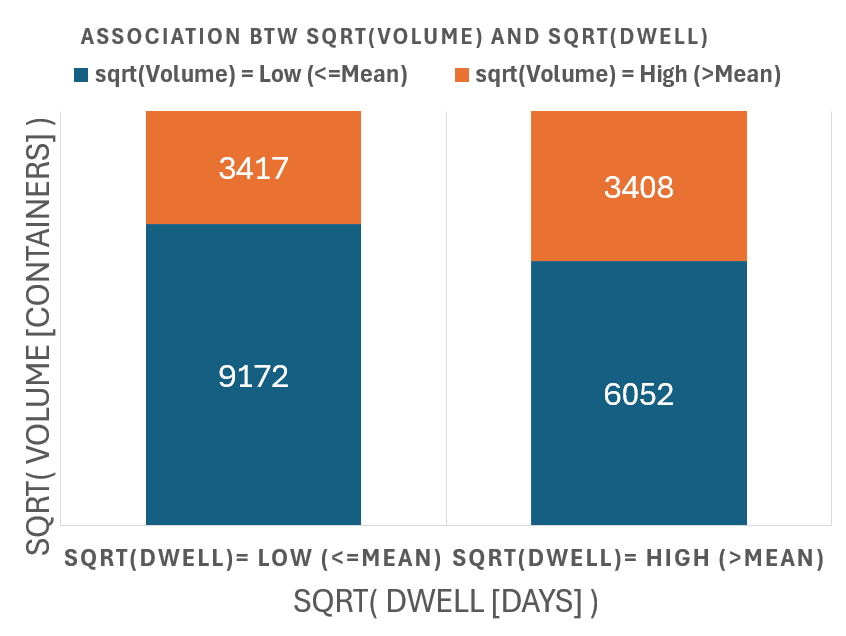
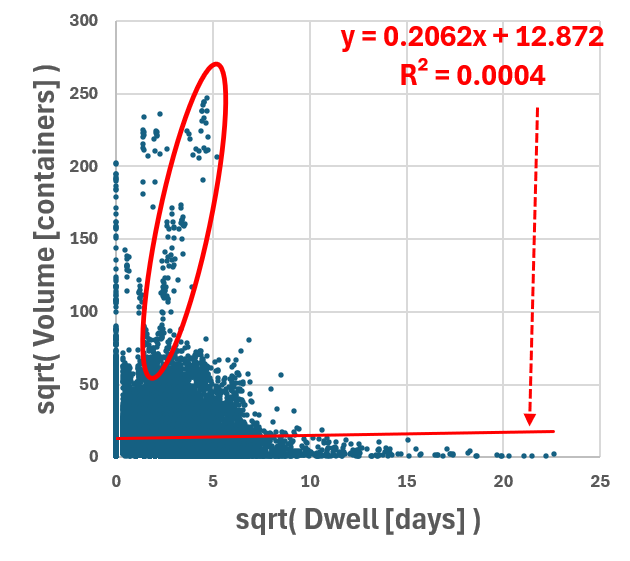
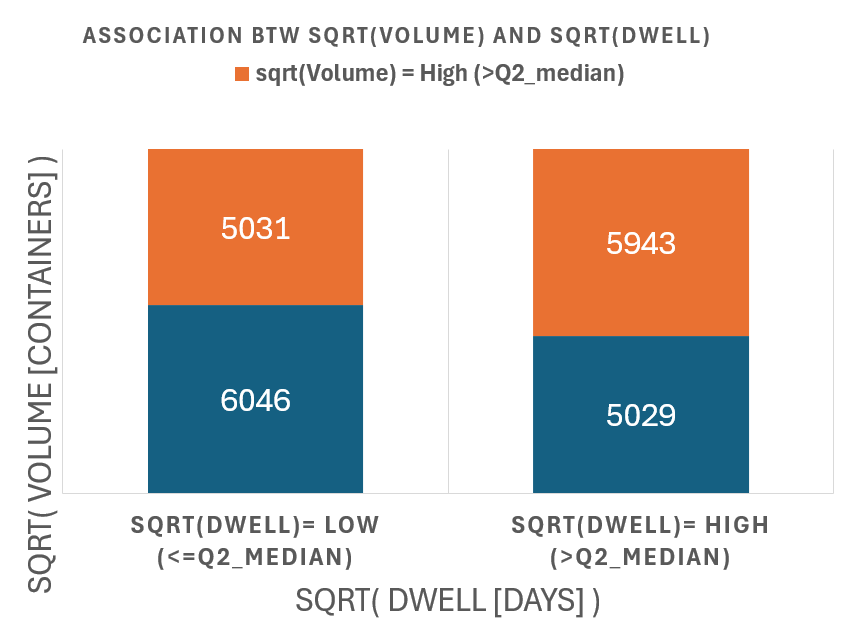
Top Row = Association Between
   y = sqrt( Volume [containers] )
   x = sqrt( Dwell [days] )
Top Left = Split High-Low by Mean
Top Right = Split High-Low by Median

Bottom Left = Scatter Plot Betwwen
   y = sqrt( Volume [containers] )
   x = sqrt( Dwell [days] )

n = Sample Size
  = 22049
r = rho_{s}
  = Sample Correlation Coefficient
  = CORREL( ln(Volume), ln(Dwell) )
  = +0.0209

Relationship between Volume and Dwell is
STILL NOT LINEAR
but it looks like there is some form shaping up.
There looks like
   a 'spike' cluster with (+) correlation (red oval)
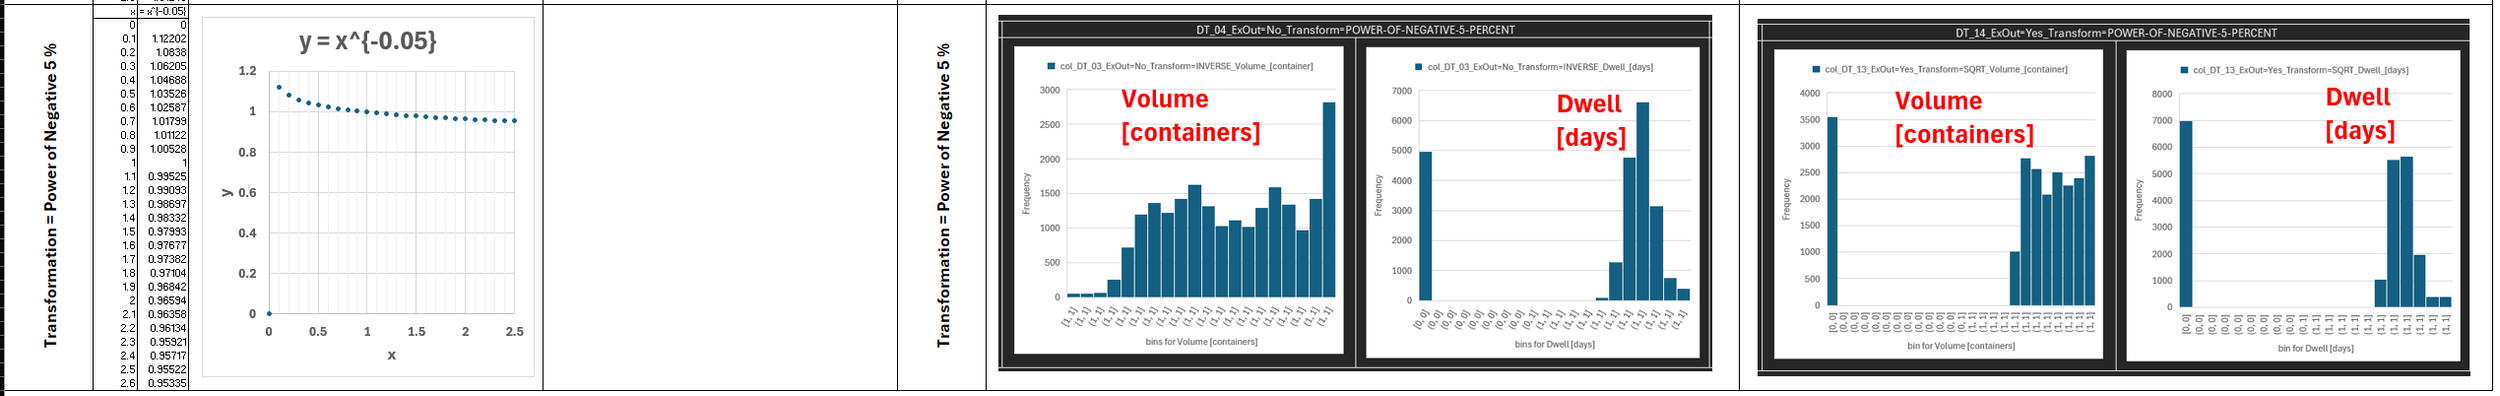
Data Transformed = Data^{-0.05} = Data to the Power of Negative 5 Percent
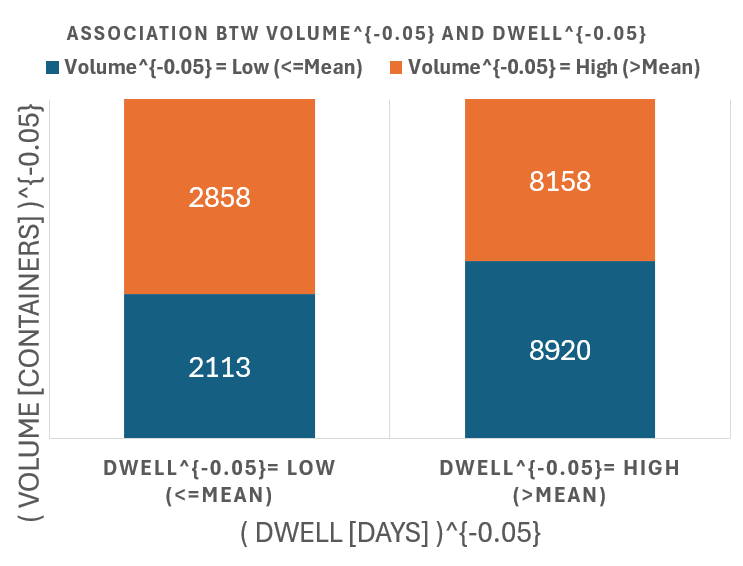
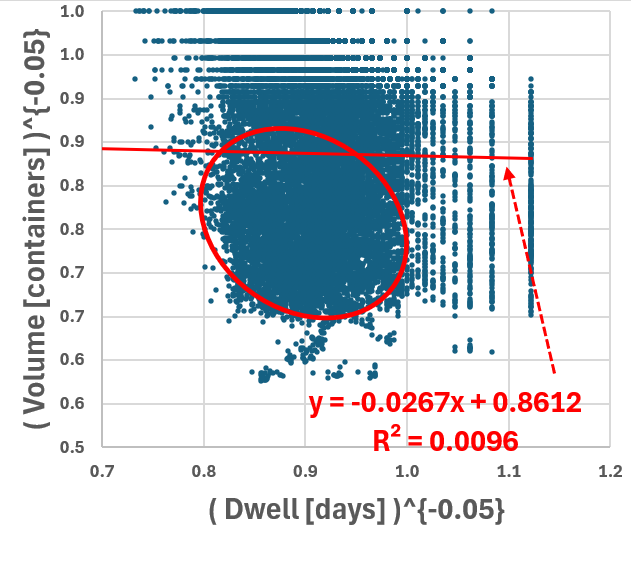
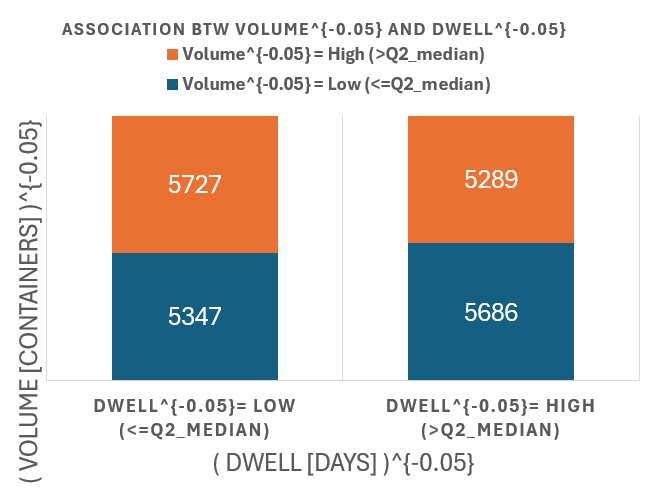
Top Row = Association Between
   y = ( Volume [containers] )^{-0.05}
   x = ( Dwell [days]        )^{-0.05}
Top Left = Split High-Low by Mean
Top Right = Split High-Low by Median

Bottom Left = Scatter Plot Betwwen
   y = ( Volume [containers] )^{-0.05}
   x = ( Dwell [days]        )^{-0.05}

n = Sample Size
  = 22049
r = rho_{s}
  = Sample Correlation Coefficient
  = CORREL( ln(Volume), ln(Dwell) )
  = -0.0977

Relationship between Volume and Dwell is
STILL NOT LINEAR