
XL-Data-Pivot-Chart-Box-Vertical
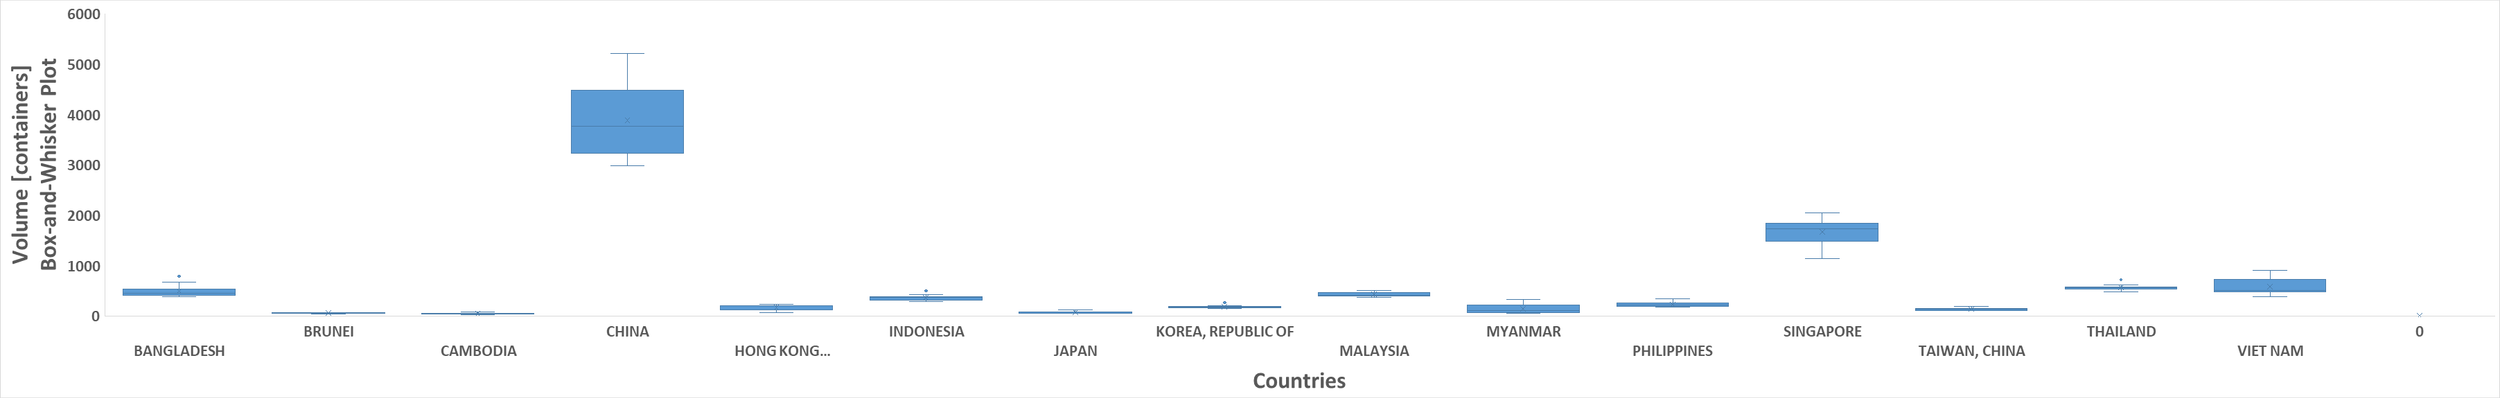
XL-Data-Pivot-Chart-Box-Vertical
> y      = Volume [containers] - Statistical Box-and-Whisker
> x      = Countries (Asia)
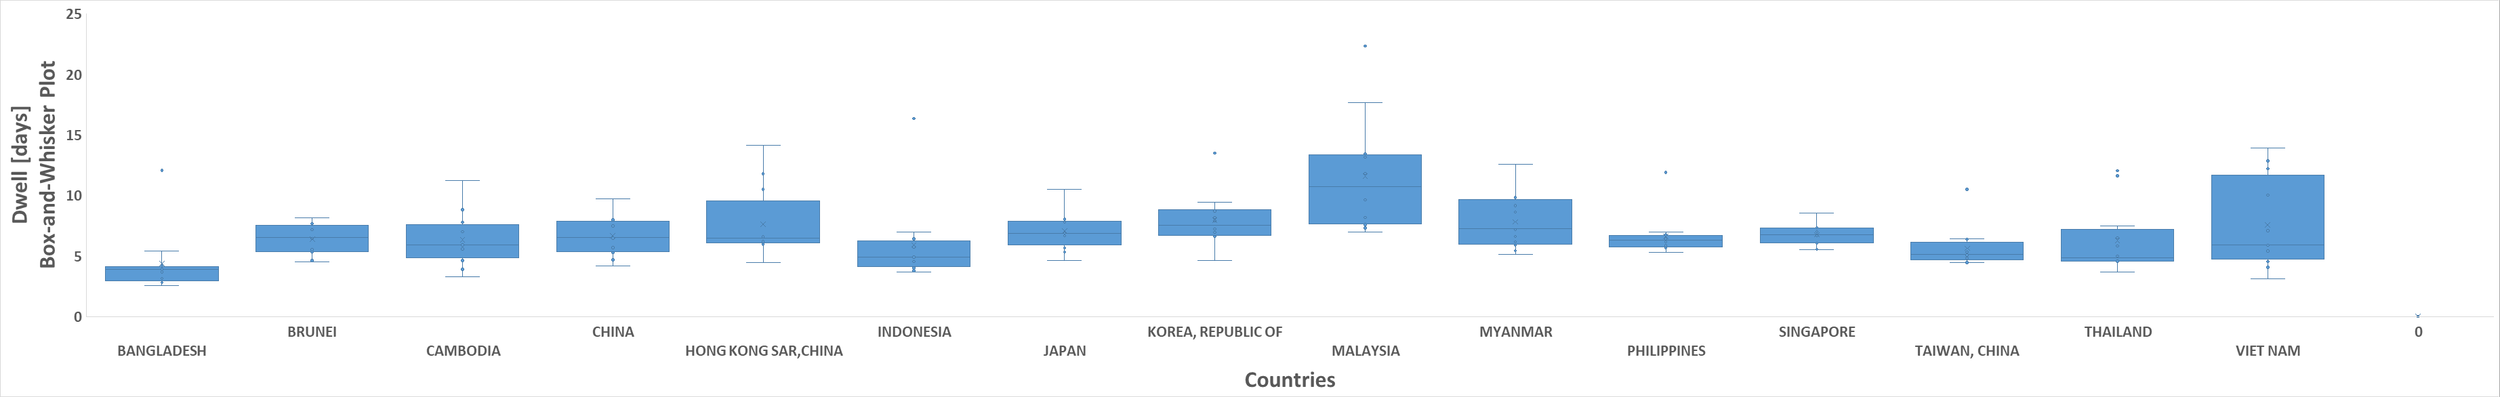
XL-Data-Pivot-Chart-Box-Vertical
> y      = Dwell [days] - Statistical Box-and-Whisker
> x      = Countries (Asia)
XL-Data-Box
XL-Data-Box

Box-Plots (2 categories side-by-side)
Excel
> Ctrl + Click to select 2 columns:
     Date          = x Category
     Close (Price) = y Value
> Insert > Insert Statistic Chart > Box and Whisker Plot