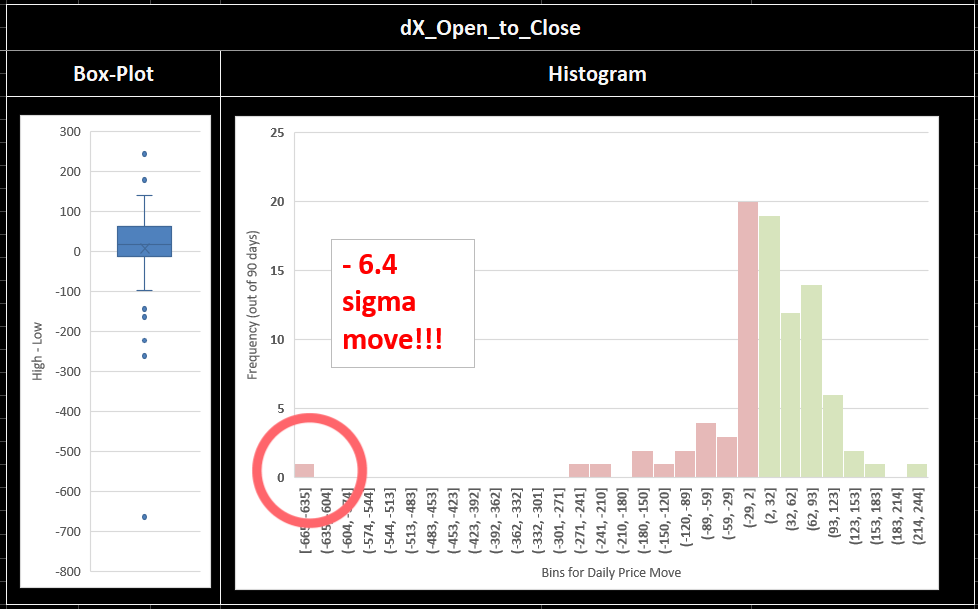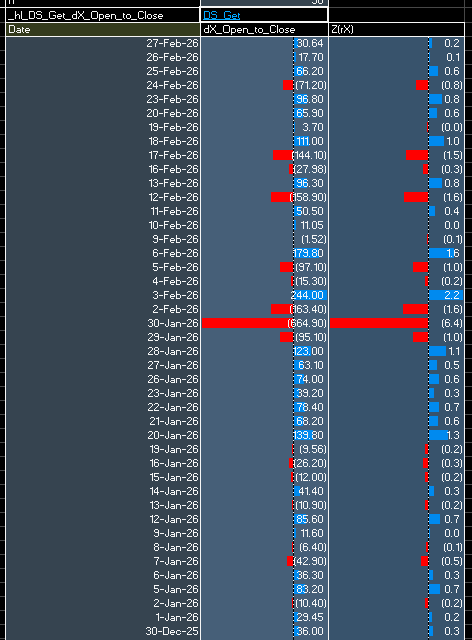
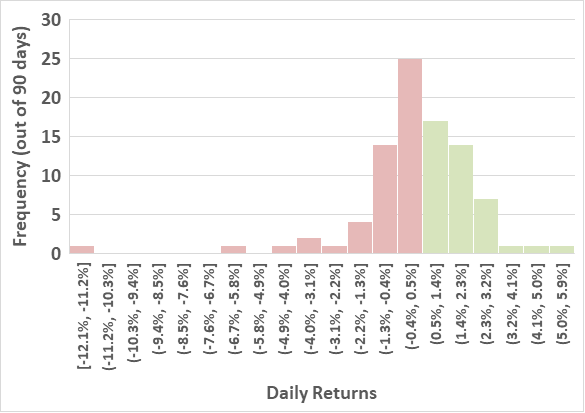
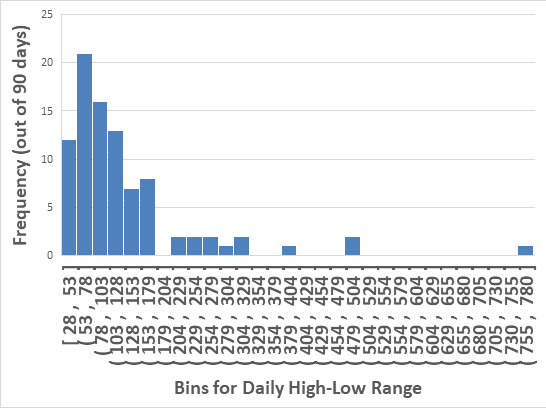
2026-03-06
C_US_USD_CME-COMEX_Fut_GC
Stats_90d
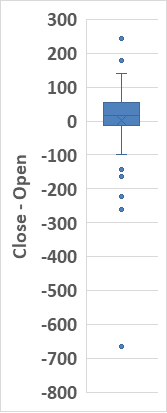
Daily Returns
> Histogram
> Box-Plot (Approximately aligned to x-axis of histogram)

y = Move  = Open to Close = Close - Open
x = Range = Low  to High  = High  - Low
y     = f( x      )
yMove = f( xRange )

> Scatter Plot
> yBox, yHist (aligned to y-axis of scatter plot)
> xBox, xHist (aligned to x-axis of scatter plot)


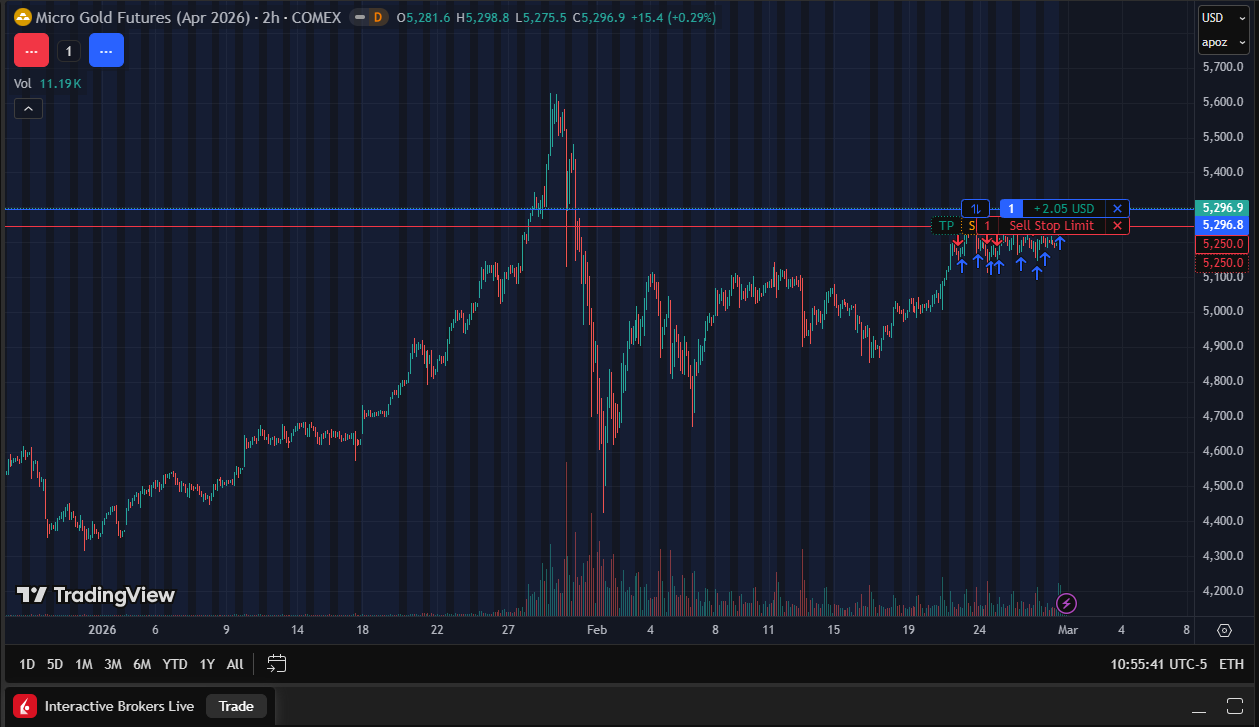
2026-02-28