
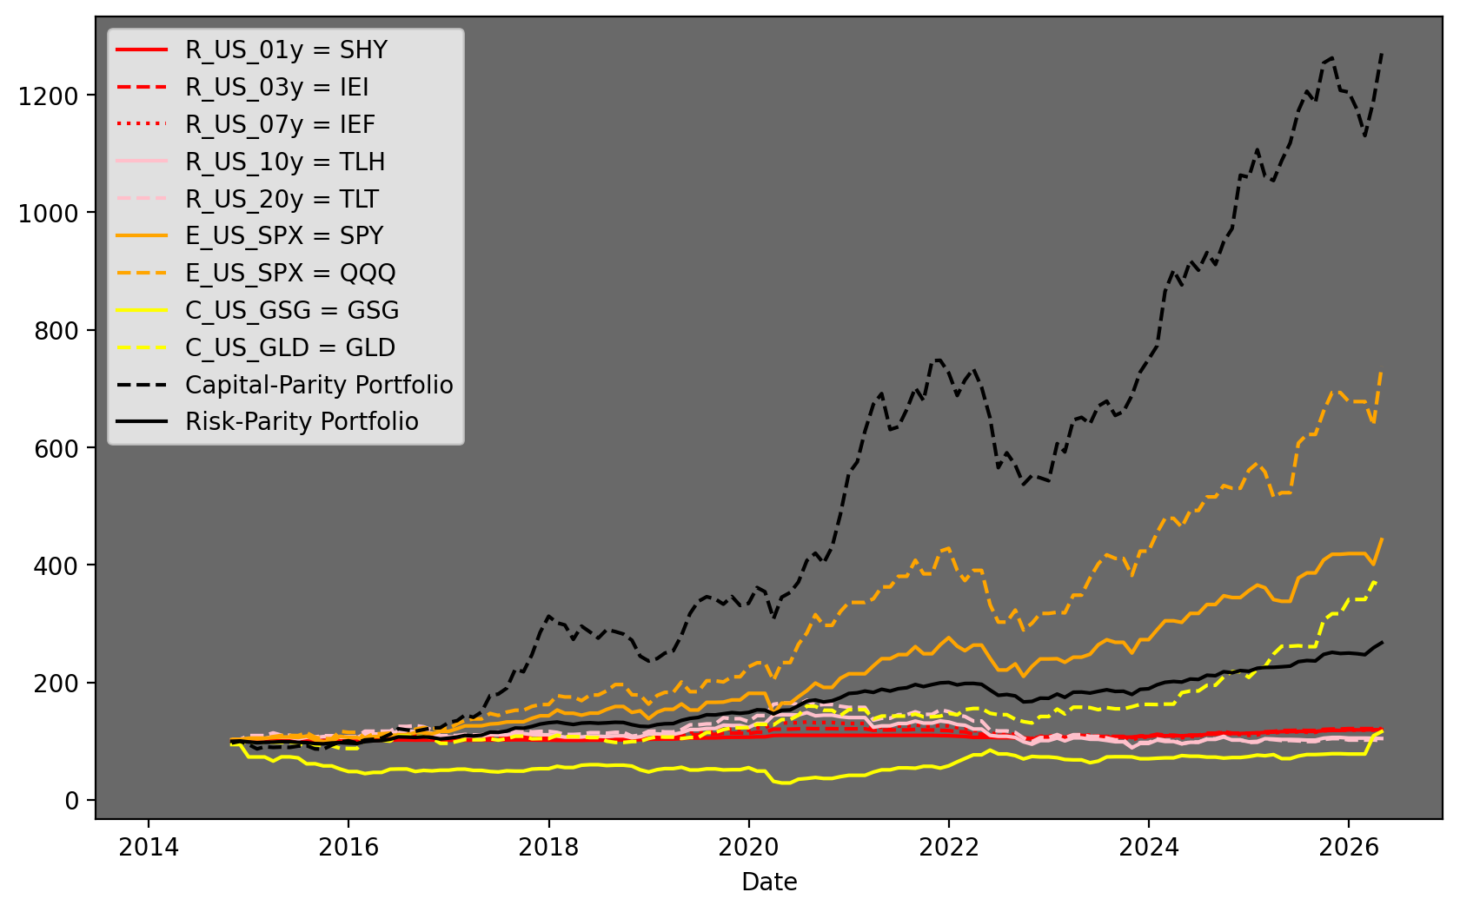
2026-04
10 year hindsight

Universe
   R = Rates
   E = Equities
   C = Commodities
   D = Digital    (omitted due to skew)

Capital-parity allocation (black-dotted)
would have performed 5x that of
Risk-parity allocation (black-solid)
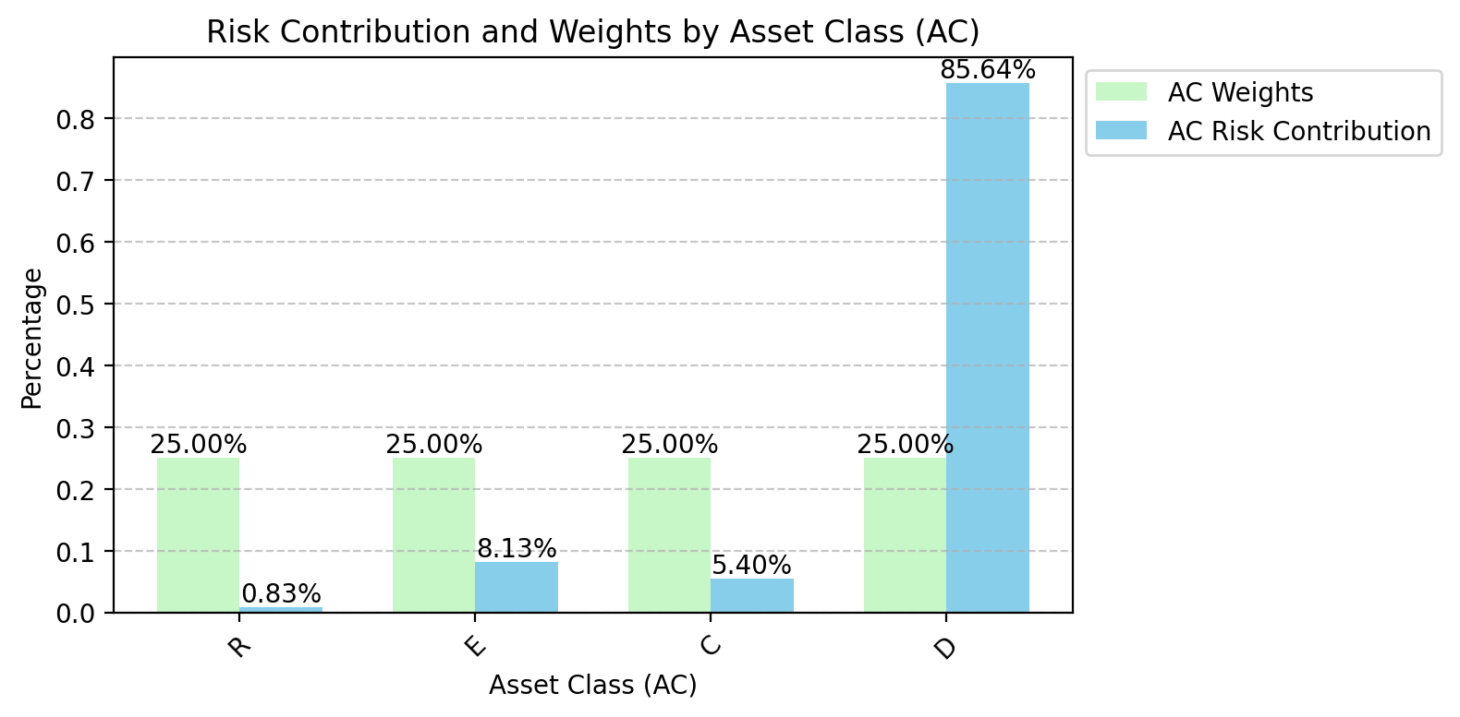
Capital-parity allocation (equal green bars)
meant a disproportionate risk allocation (blue bars)
to Digital assets (Bitcoin)

Drawdowns would not have been easily ignored.
Such a position would not have been easy to hold.
Not an institutional solution.
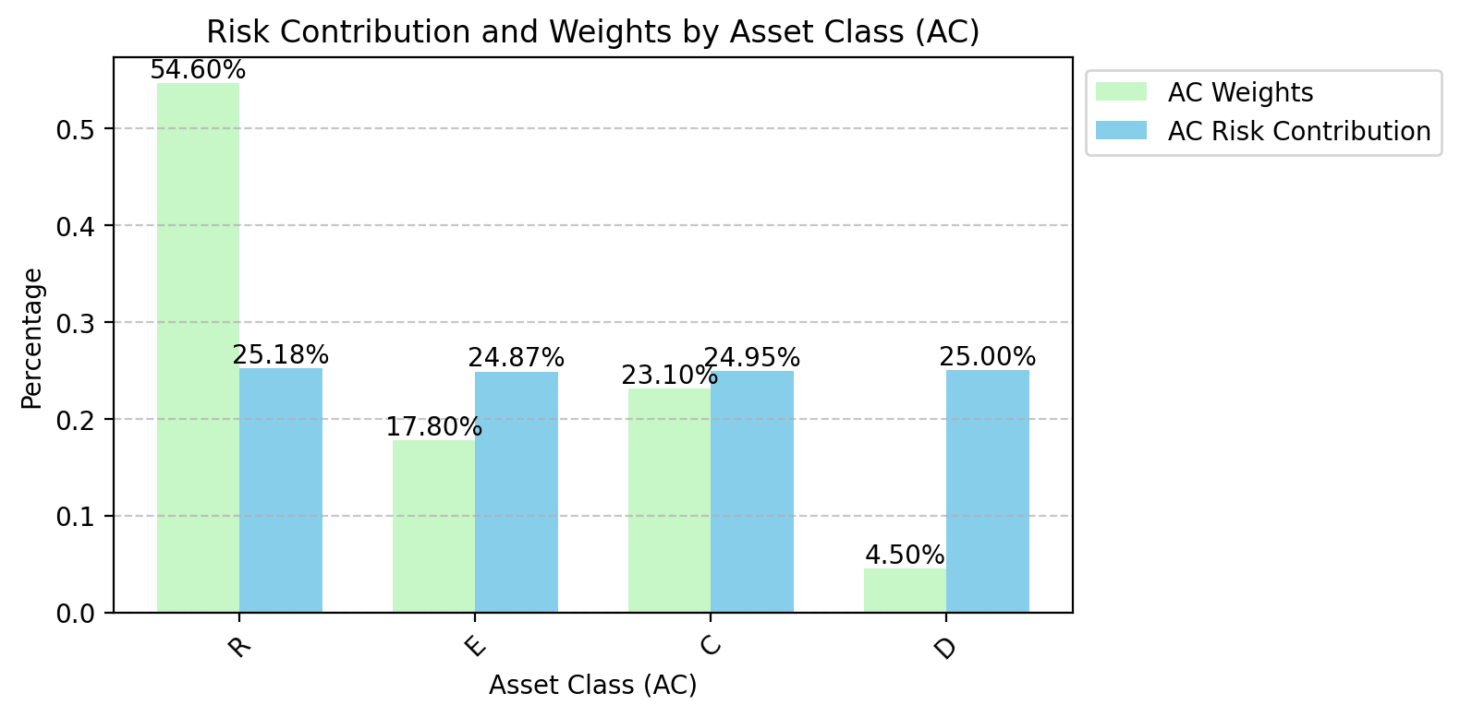
Risk-parity allocation (equal blue bars)
meant a 55 % capital allocation in Rates.

US Treasuries still form the bedrock for institutions.
A hindsight optimal allocation of
18 % in equities (growth-driven),
23 % in commodities (inflation-driven),
suggests that
corporate earnings have been outpaced by inflation
in the last 10 years

 5 % in digital (innovation-driven)
suggests a transition in the last 10 years

A moving window analysis back in time
might prove interesting...
or even valuable as a forecast into the future?
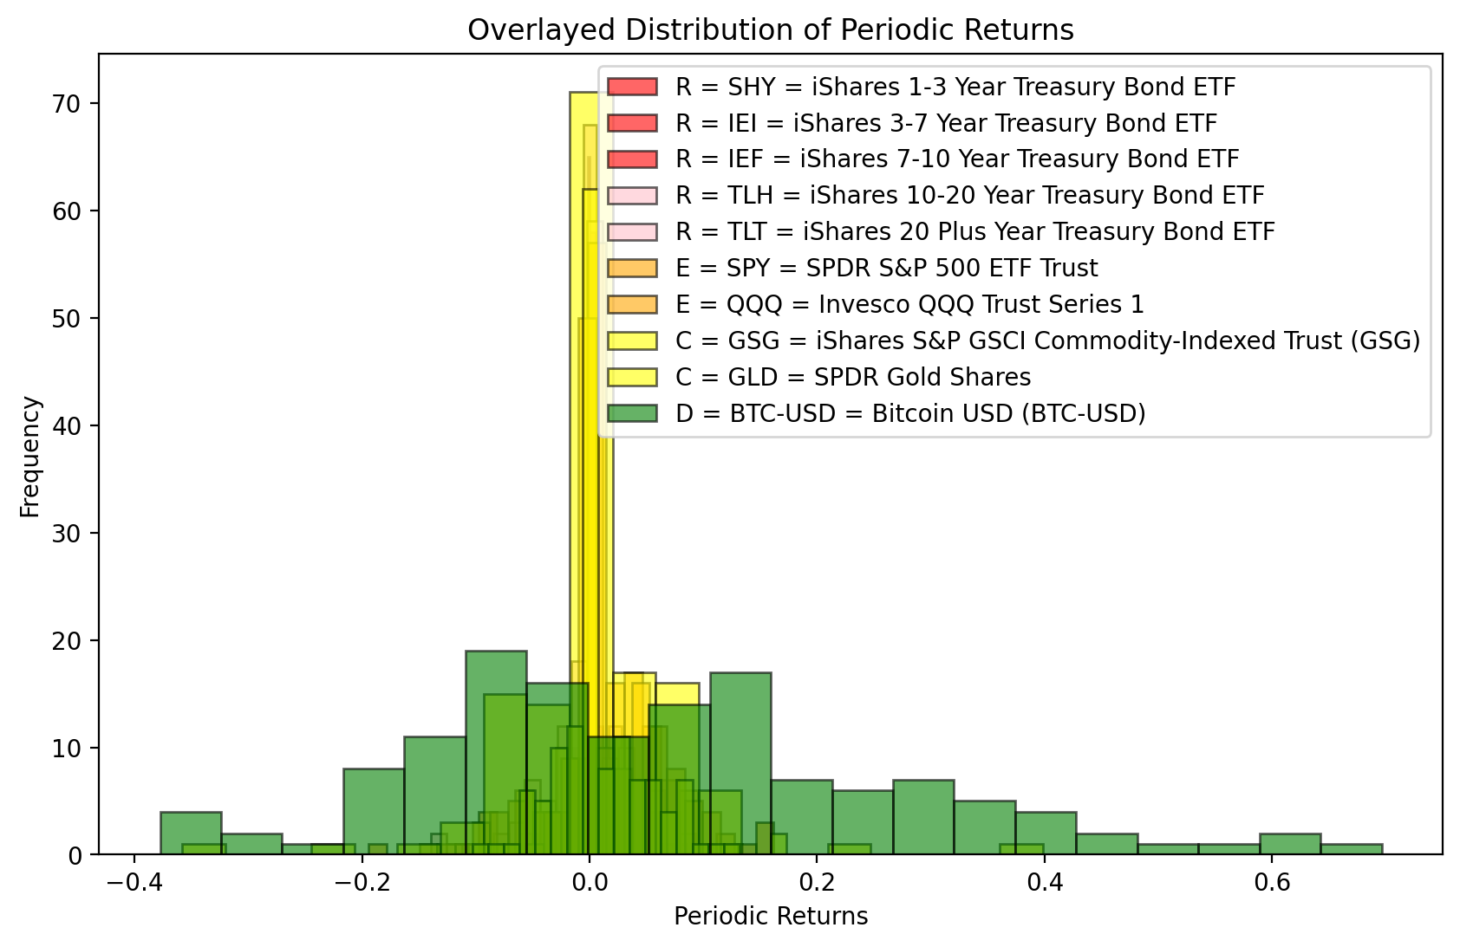
2026-04
10 year lookback

Distribution of Historical Annualized Returns

Data:
Historical Montly Returns

Digital Assets (Bitcoin)
clearly a volatile store of energy