
Data-Pivot-Chart-Bar-Vertical-Clustered-Stacked
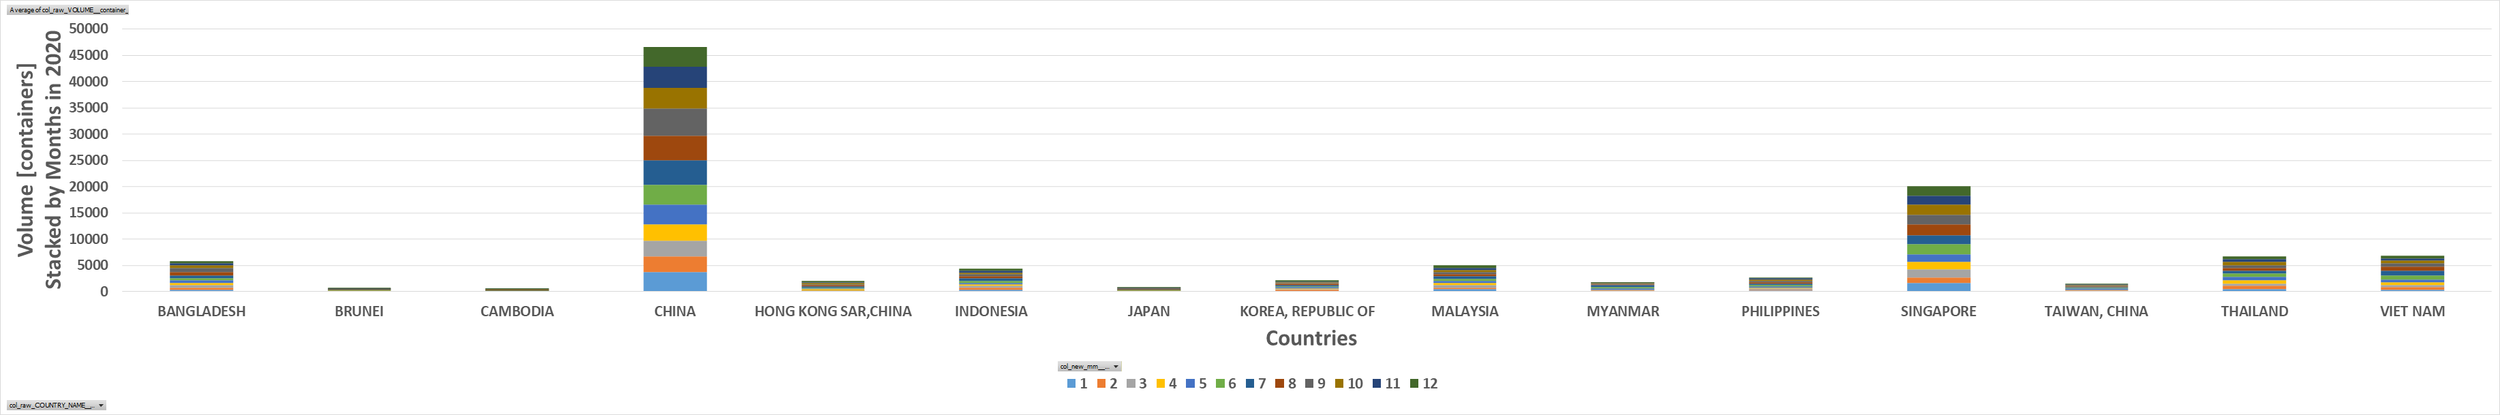
Data-Pivot-Chart-Bar-Vertical-Clustered-Stacked (by Legend)
> y      = Volume [containers]
> x      = Countries (Asia)
> legend = 2020.mm
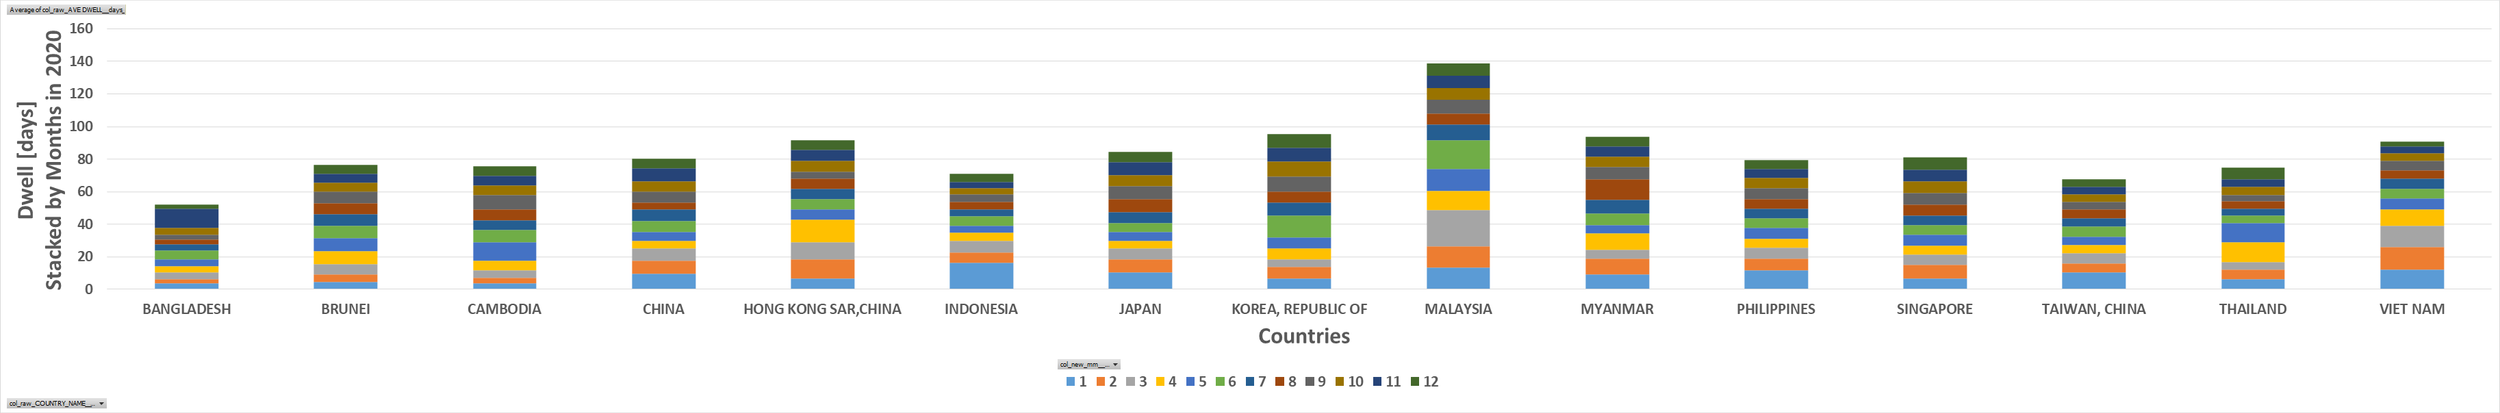
Data-Pivot-Chart-Bar-Vertical-Clustered-Stacked (by Legend)
> y      = Dwell [days]
> x      = Countries (Asia)
> legend = 2020.mm
Data-Pivot-Chart-Bar-Vertical-Clustered-Stacked
Data-Pivot-Chart-Bar-Vertical-Clustered-Stacked

Pivot Chart
+-- x_Cat_Bins   = Axis (Categories)
+-- y_Num_Values = Values
+-- by           = Legend (Series)
> Right-Click
> Change Chart Type
  > Column > Stacked Column Charts