
Data-Chart-Histogram
Data-Chart-Histogram
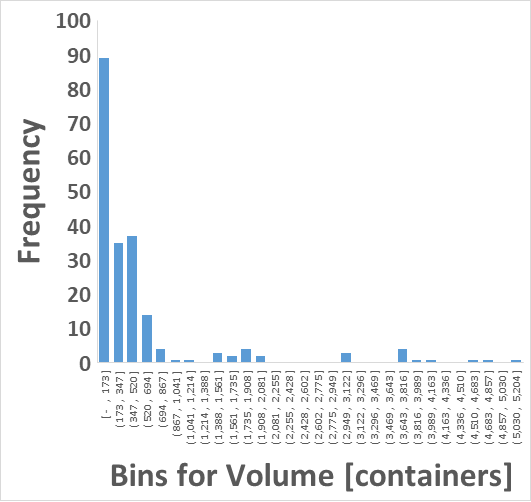
> y = Frequency or Data Count
> x = Bins for Volume [containers]
= Bin 1 to 30
Data-Chart-Histogram
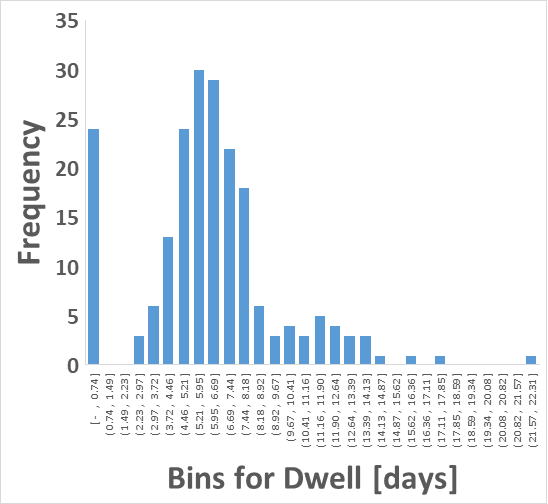
> y = Frequency or Data Count
> x = Bins for Dwell [days]
= Bin 1 to 30
Data-Chart-Histogram-BinEdgeLower
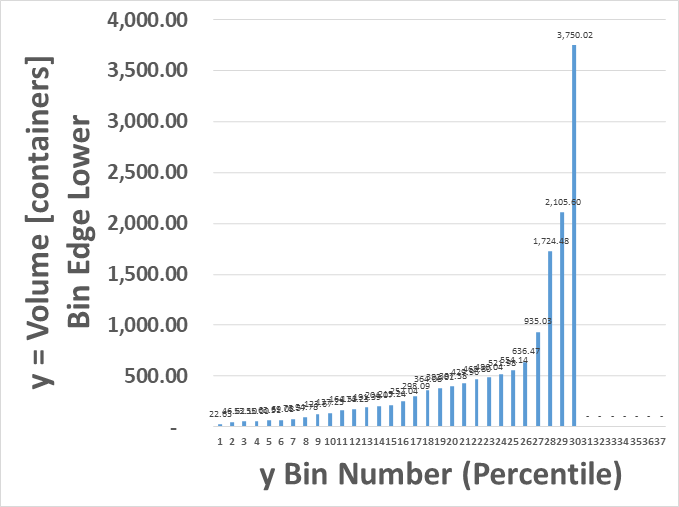
> y = Lower Edge of the Histogram Bins
> x = Bin Number for Volume [containers]
= Bin 1 to 30
Data-Chart-Histogram-BinEdgeLower
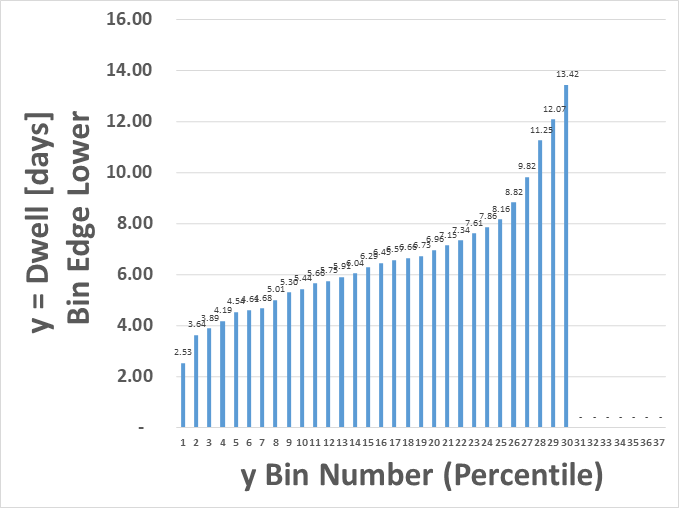
> y = Lower Edge of the Histogram Bins
> x = Bin Number for Dwell [days]
= Bin 1 to 30
Data-Chart-Histogram
Data-Chart-Histogram

Excel
> Select column of Data
  > Insert > Statistical Charts > Histogram
    > Ctrl+X to Cut
    > Ctrl+V to Paste
    > Top Right '+' Sign
      > Add Axis Titles
    > Right-click x-axis
      > Format Axis
        > Set Number of Bins