
Data-Pivot-Chart
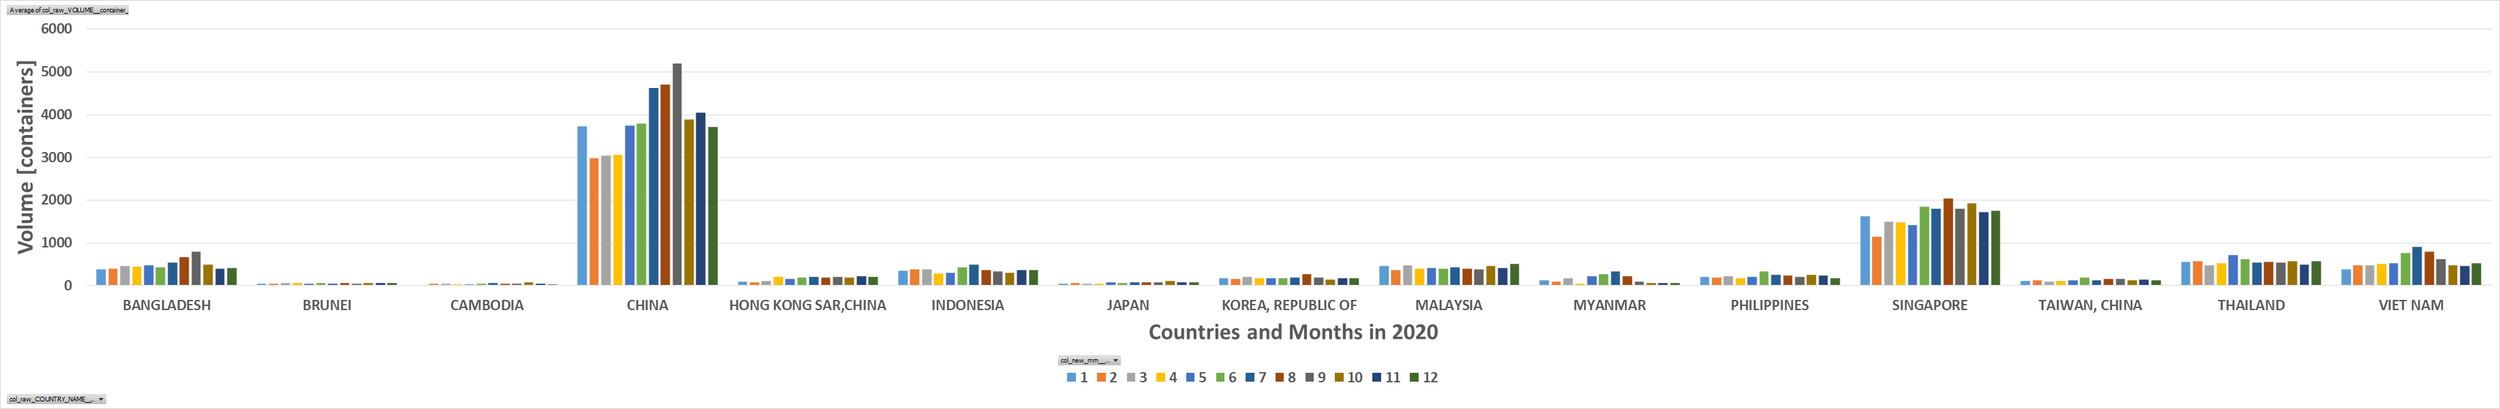
Data-Pivot-Chart-Bar-Vertical-Clustered (by Legend)
> y      = Volume [containers]
> x      = Countries (Asia)
> legend = 2020.mm
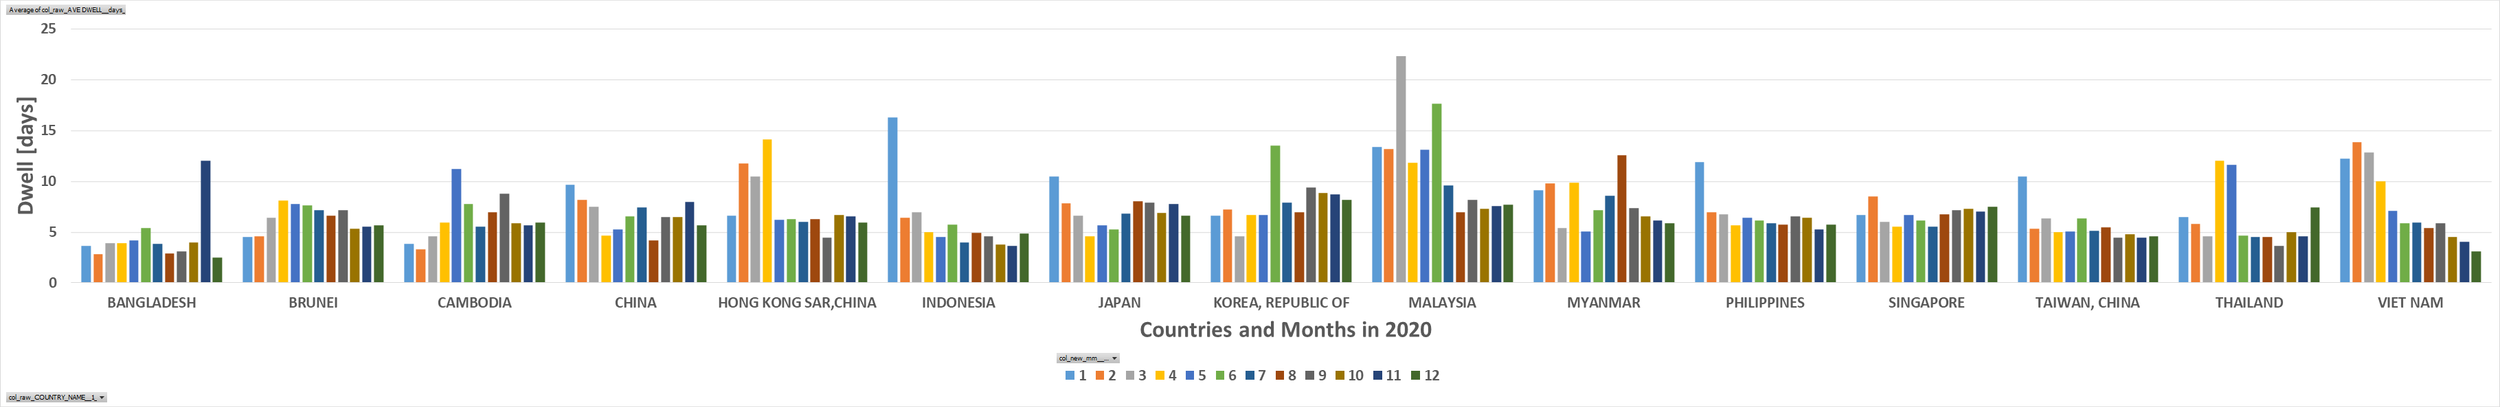
Data-Pivot-Chart-Bar-Vertical-Clustered (by Legend)
> y      = Dwell [days]
> x      = Countries (Asia)
> legend = 2020.mm
Data-Legend
Data-Legend

Excel: PivotTable, PivotChart
> PivotTable Fields
  > y = Values
    > y_Num_Volume
  > x = Axis (Categories)
    > x_Cat_Countries
    > x_Cat_Months         >>> Move to Section Legend
  > z = Legend (Series)
    > z_Cat_Months         <<< Move from Section Axis